| __timestamp | Canadian National Railway Company | Rentokil Initial plc |
|---|---|---|
| Wednesday, January 1, 2014 | 12134000000 | 1740800000 |
| Thursday, January 1, 2015 | 12611000000 | 1759000000 |
| Friday, January 1, 2016 | 12037000000 | 2168100000 |
| Sunday, January 1, 2017 | 13041000000 | 2412300000 |
| Monday, January 1, 2018 | 14321000000 | 2472300000 |
| Tuesday, January 1, 2019 | 14917000000 | 2676200000 |
| Wednesday, January 1, 2020 | 13819000000 | 2789400000 |
| Friday, January 1, 2021 | 14477000000 | 2953900000 |
| Saturday, January 1, 2022 | 17107000000 | 3714000000 |
| Sunday, January 1, 2023 | 16828000000 | 5375000000 |
Data in motion
In the world of transportation and services, Canadian National Railway Company (CNR) and Rentokil Initial plc have carved out significant niches. Over the past decade, CNR has consistently outperformed Rentokil in terms of revenue, with a staggering 500% higher average annual revenue. From 2014 to 2023, CNR's revenue grew by approximately 39%, peaking in 2022 with a 41% increase from 2014. Meanwhile, Rentokil's revenue saw a remarkable 209% growth, culminating in a 2023 peak that was 209% higher than its 2014 figures.
CNR's steady growth reflects its robust infrastructure and strategic expansions across North America. In contrast, Rentokil's explosive growth highlights its aggressive acquisition strategy and expansion into new markets. As we look to the future, these trends suggest a dynamic landscape where both companies continue to innovate and expand their global footprints.

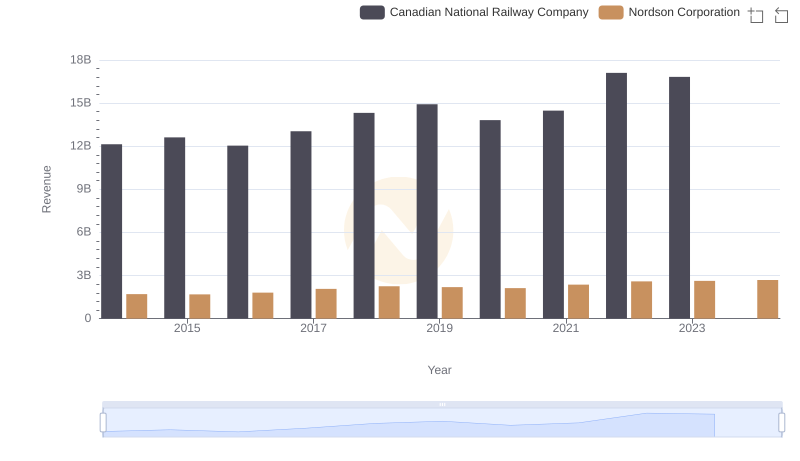
Annual Revenue Comparison: Canadian National Railway Company vs Nordson Corporation

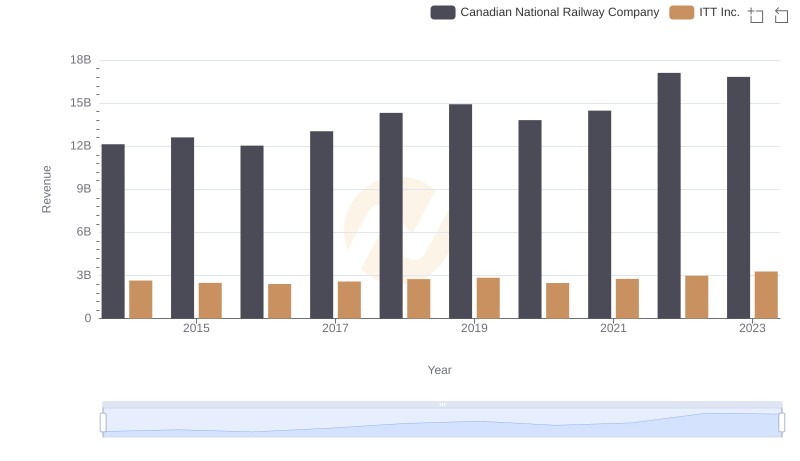
Canadian National Railway Company vs ITT Inc.: Annual Revenue Growth Compared

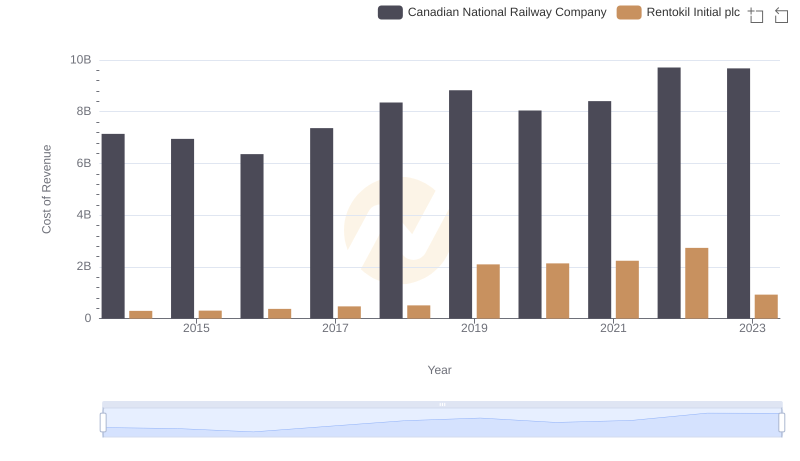
Canadian National Railway Company vs Rentokil Initial plc: Efficiency in Cost of Revenue Explored

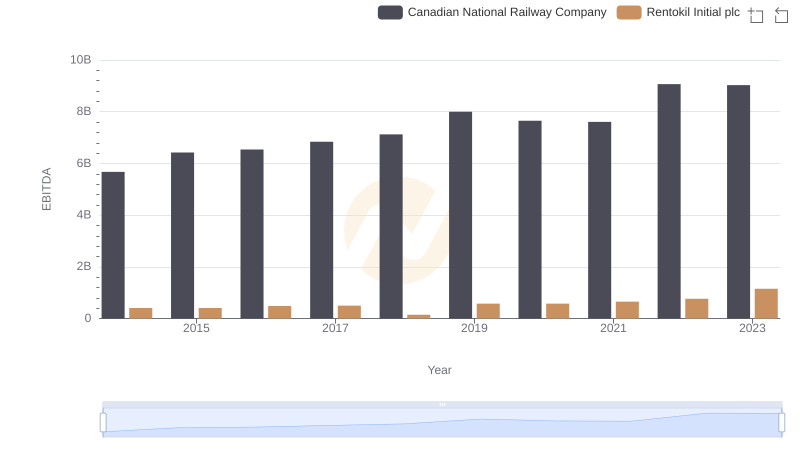
A Professional Review of EBITDA: Canadian National Railway Company Compared to Rentokil Initial plc