| __timestamp | Dell Technologies Inc. | Workday, Inc. |
|---|---|---|
| Wednesday, January 1, 2014 | 1273000000 | 182116000 |
| Thursday, January 1, 2015 | 920000000 | 316868000 |
| Friday, January 1, 2016 | 1051000000 | 469944000 |
| Sunday, January 1, 2017 | 2636000000 | 680531000 |
| Monday, January 1, 2018 | 4384000000 | 910584000 |
| Tuesday, January 1, 2019 | 4604000000 | 1211832000 |
| Wednesday, January 1, 2020 | 2454000000 | 1549906000 |
| Friday, January 1, 2021 | 2455000000 | 1721222000 |
| Saturday, January 1, 2022 | 2577000000 | 1879220000 |
| Sunday, January 1, 2023 | 2779000000 | 2270660000 |
| Monday, January 1, 2024 | 2801000000 | 2464000000 |
Igniting the spark of knowledge
In the ever-evolving tech landscape, research and development (R&D) expenses are a testament to a company's commitment to innovation. Over the past decade, Dell Technologies Inc. and Workday, Inc. have demonstrated contrasting yet intriguing R&D investment strategies.
From 2014 to 2024, Dell Technologies Inc. has consistently outpaced Workday, Inc. in R&D spending, peaking in 2019 with a staggering 4.6 billion dollars. This represents a 260% increase from their 2015 low. Meanwhile, Workday, Inc. has shown a steady upward trajectory, with R&D expenses growing by over 1,250% from 2014 to 2024, reaching nearly 2.5 billion dollars.
These figures highlight Dell's aggressive investment in innovation, while Workday's consistent growth underscores its strategic focus on long-term development. As the tech industry continues to evolve, these investments will likely shape the future of both companies.
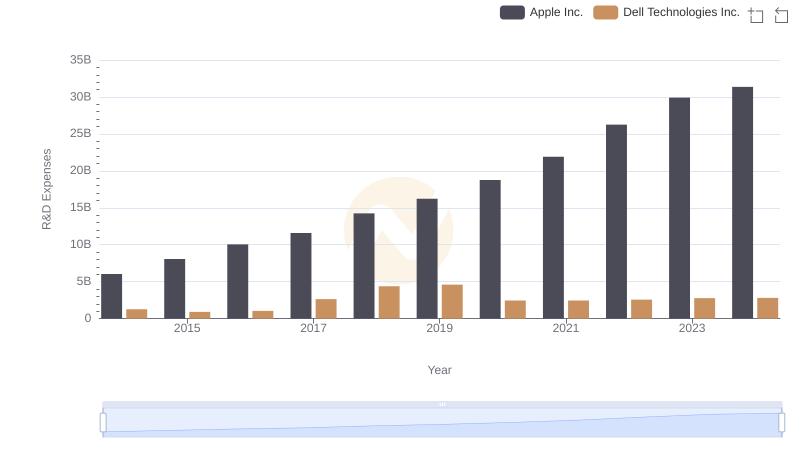
Research and Development Expenses Breakdown: Apple Inc. vs Dell Technologies Inc.
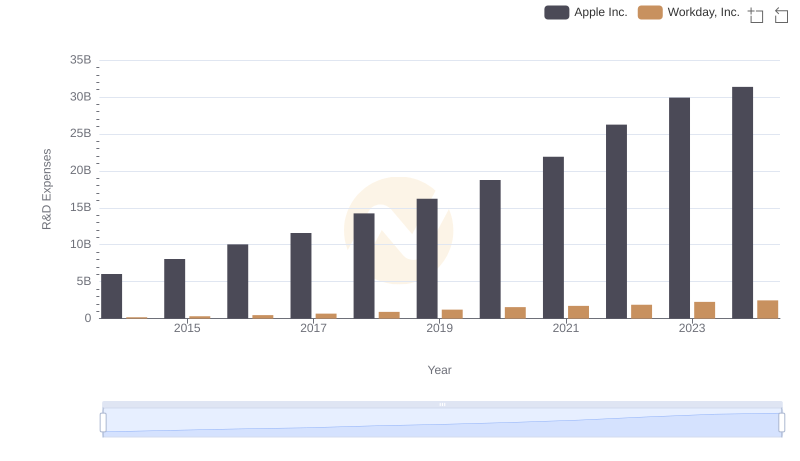
Analyzing R&D Budgets: Apple Inc. vs Workday, Inc.
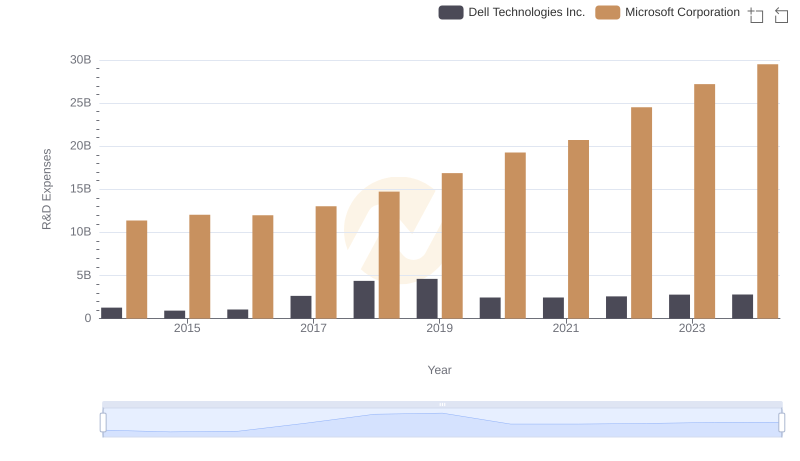
Microsoft Corporation vs Dell Technologies Inc.: Strategic Focus on R&D Spending
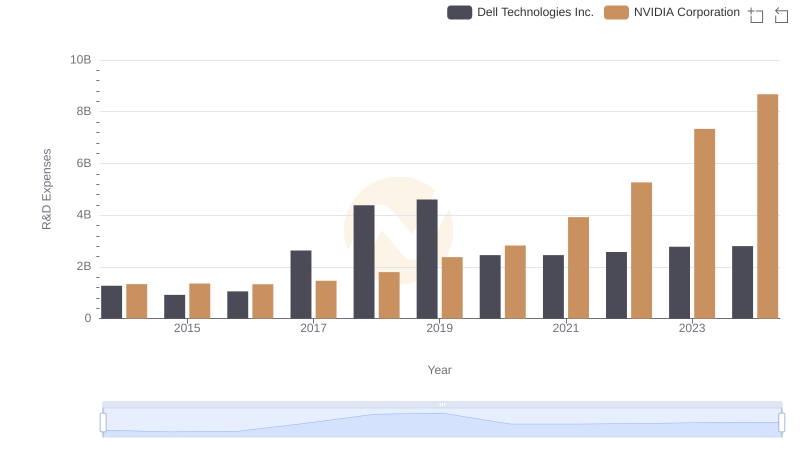
Comparing Innovation Spending: NVIDIA Corporation and Dell Technologies Inc.
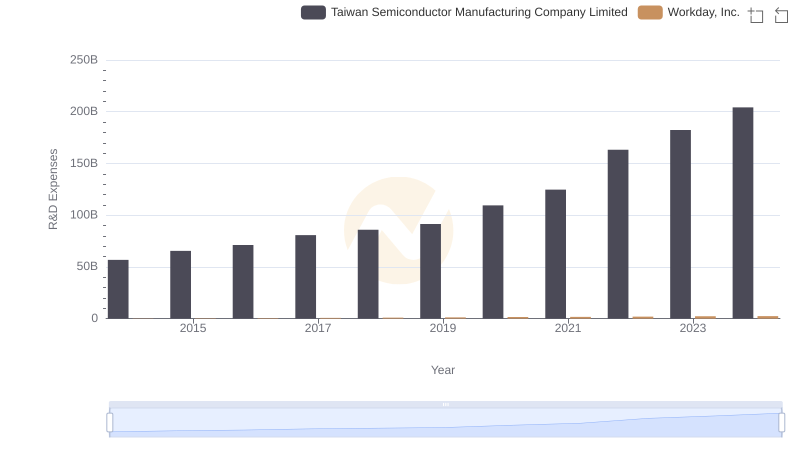
Who Prioritizes Innovation? R&D Spending Compared for Taiwan Semiconductor Manufacturing Company Limited and Workday, Inc.
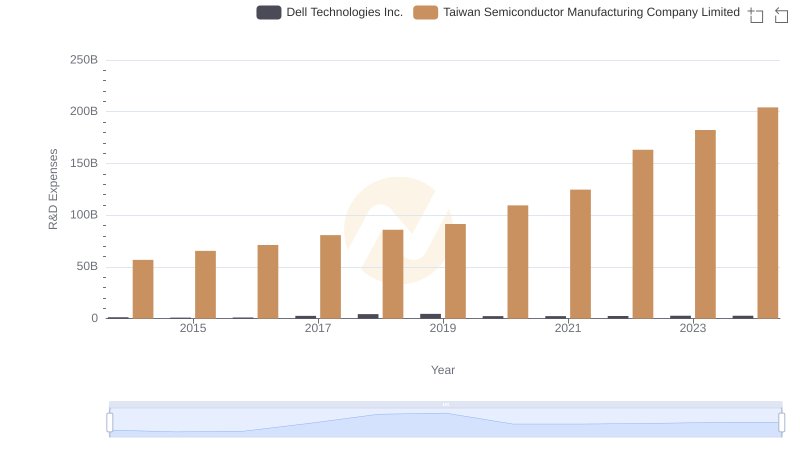
R&D Insights: How Taiwan Semiconductor Manufacturing Company Limited and Dell Technologies Inc. Allocate Funds
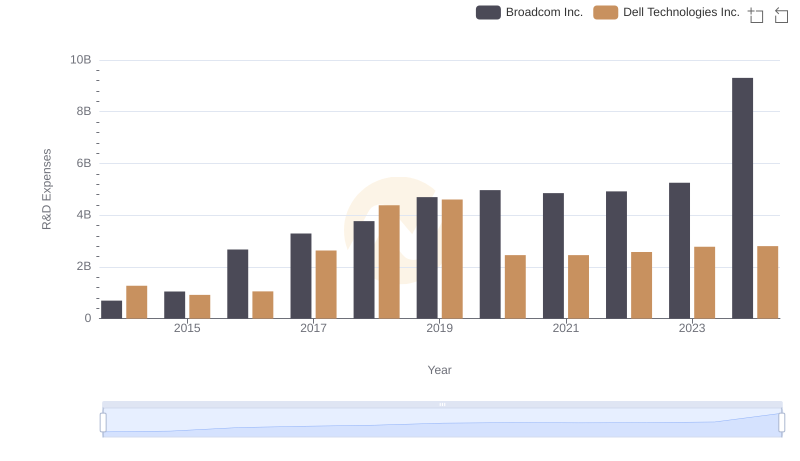
Research and Development Expenses Breakdown: Broadcom Inc. vs Dell Technologies Inc.
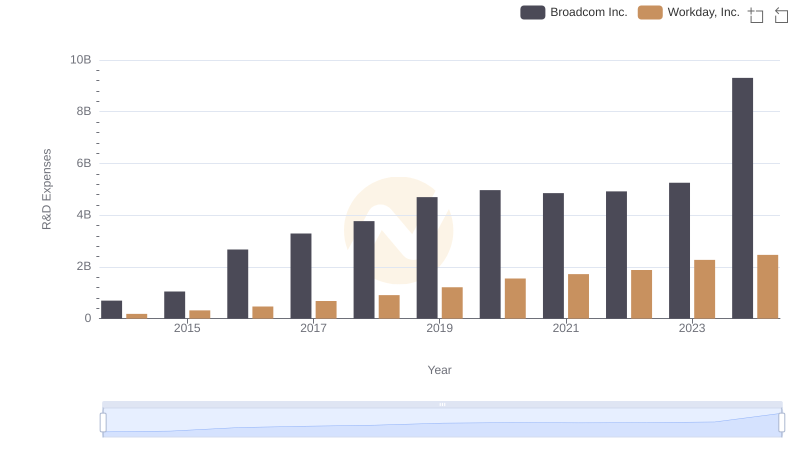
R&D Insights: How Broadcom Inc. and Workday, Inc. Allocate Funds
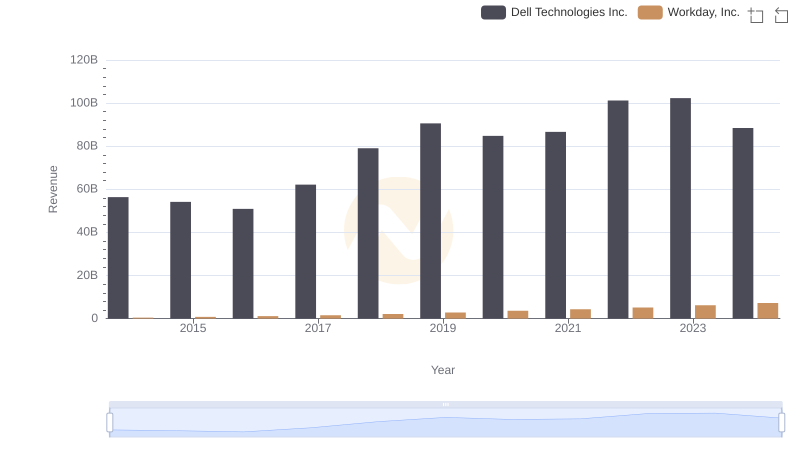
Comparing Revenue Performance: Dell Technologies Inc. or Workday, Inc.?
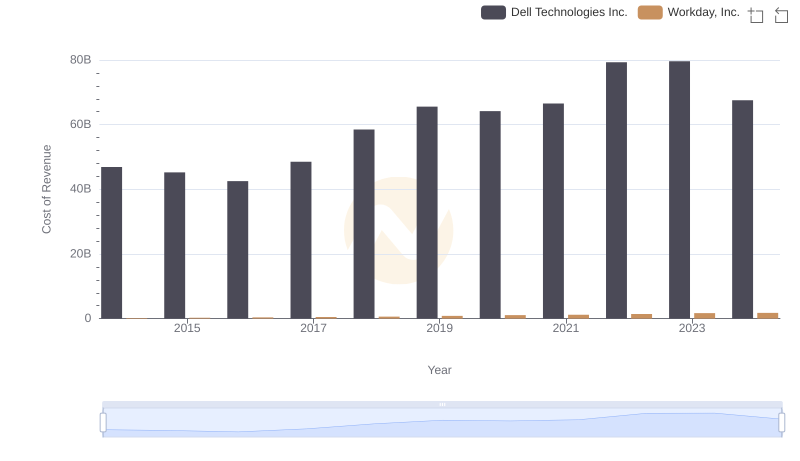
Cost Insights: Breaking Down Dell Technologies Inc. and Workday, Inc.'s Expenses

Gross Profit Analysis: Comparing Dell Technologies Inc. and Workday, Inc.
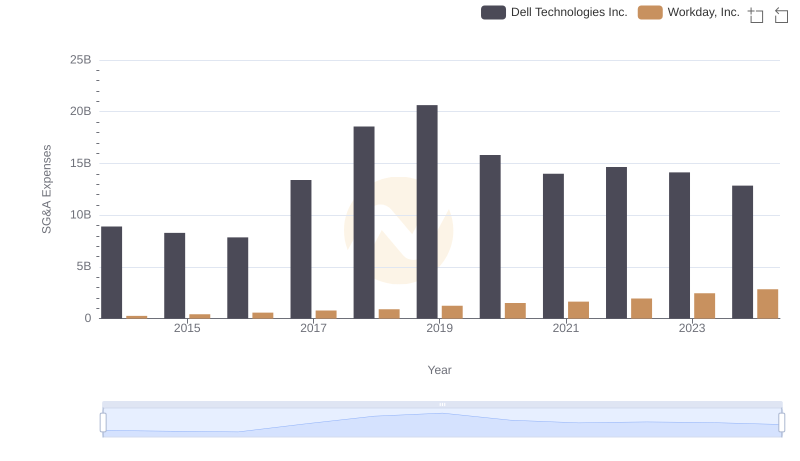
Dell Technologies Inc. or Workday, Inc.: Who Manages SG&A Costs Better?