| __timestamp | Dell Technologies Inc. | Workday, Inc. |
|---|---|---|
| Wednesday, January 1, 2014 | 46892000000 | 176810000 |
| Thursday, January 1, 2015 | 45246000000 | 264803000 |
| Friday, January 1, 2016 | 42524000000 | 374427000 |
| Sunday, January 1, 2017 | 48515000000 | 483545000 |
| Monday, January 1, 2018 | 58503000000 | 629413000 |
| Tuesday, January 1, 2019 | 65568000000 | 834950000 |
| Wednesday, January 1, 2020 | 64176000000 | 1065258000 |
| Friday, January 1, 2021 | 66530000000 | 1198132000 |
| Saturday, January 1, 2022 | 79306000000 | 1428095000 |
| Sunday, January 1, 2023 | 79615000000 | 1715178000 |
| Monday, January 1, 2024 | 67556000000 | 1771000000 |
Unleashing insights
In the ever-evolving landscape of technology, understanding the cost dynamics of industry giants like Dell Technologies Inc. and Workday, Inc. is crucial. Over the past decade, Dell has consistently maintained a robust cost of revenue, peaking in 2023 with a 70% increase from 2014. This reflects Dell's strategic investments and operational efficiencies. In contrast, Workday, Inc., a leader in cloud-based enterprise solutions, has seen its cost of revenue grow by nearly 900% since 2014, highlighting its rapid expansion and scaling efforts.
These insights provide a window into the strategic priorities and market positioning of these tech titans.
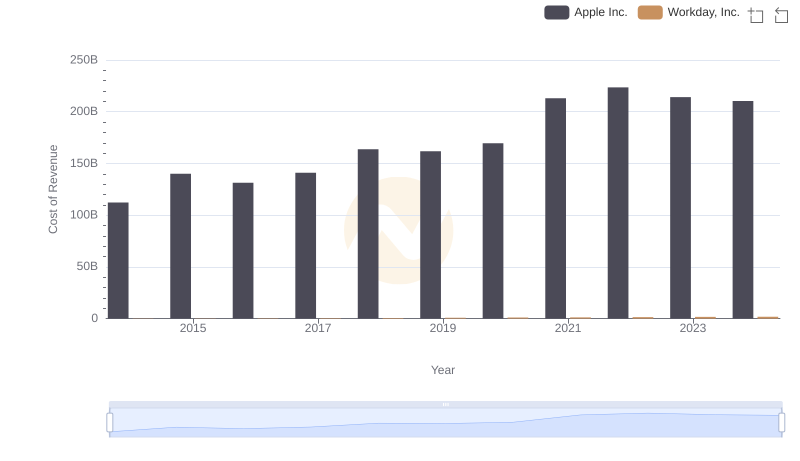
Cost of Revenue: Key Insights for Apple Inc. and Workday, Inc.
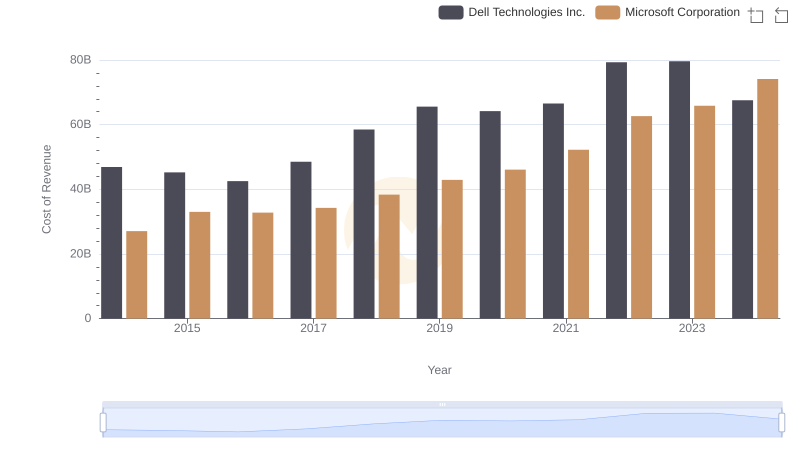
Cost Insights: Breaking Down Microsoft Corporation and Dell Technologies Inc.'s Expenses
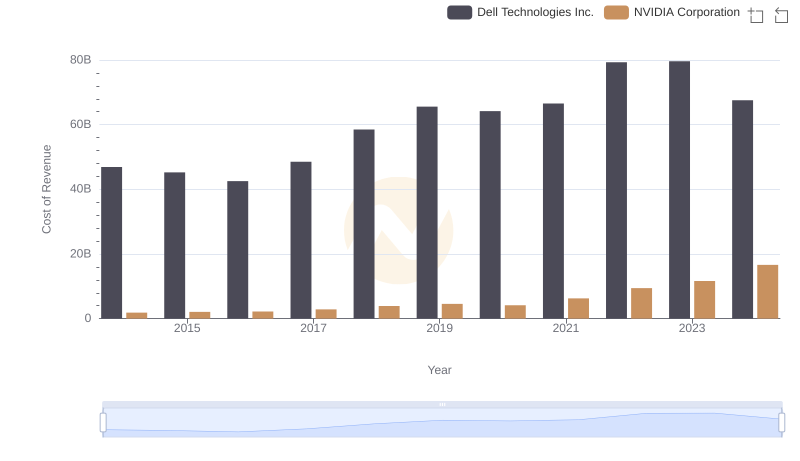
NVIDIA Corporation vs Dell Technologies Inc.: Efficiency in Cost of Revenue Explored
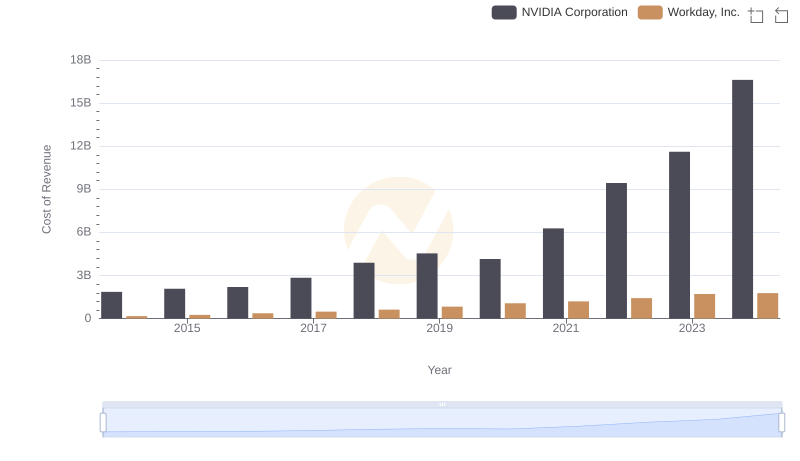
Cost of Revenue: Key Insights for NVIDIA Corporation and Workday, Inc.
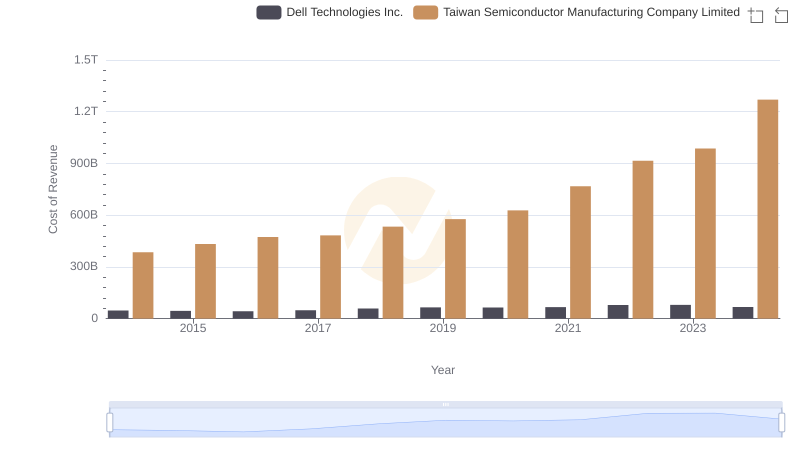
Cost of Revenue Trends: Taiwan Semiconductor Manufacturing Company Limited vs Dell Technologies Inc.
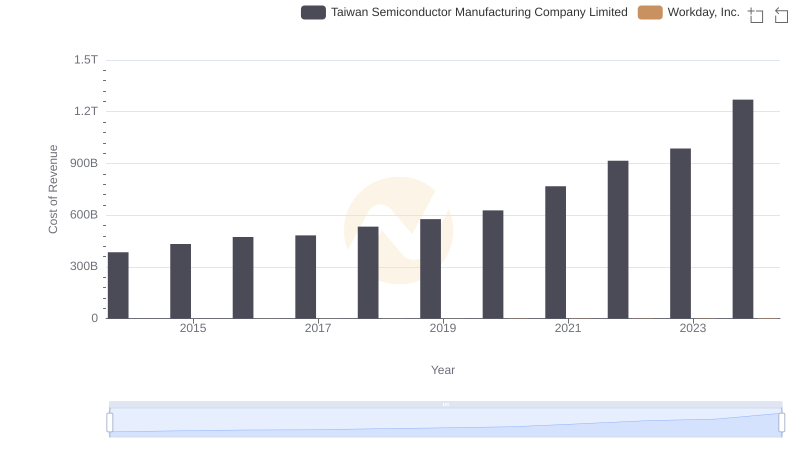
Cost of Revenue Trends: Taiwan Semiconductor Manufacturing Company Limited vs Workday, Inc.
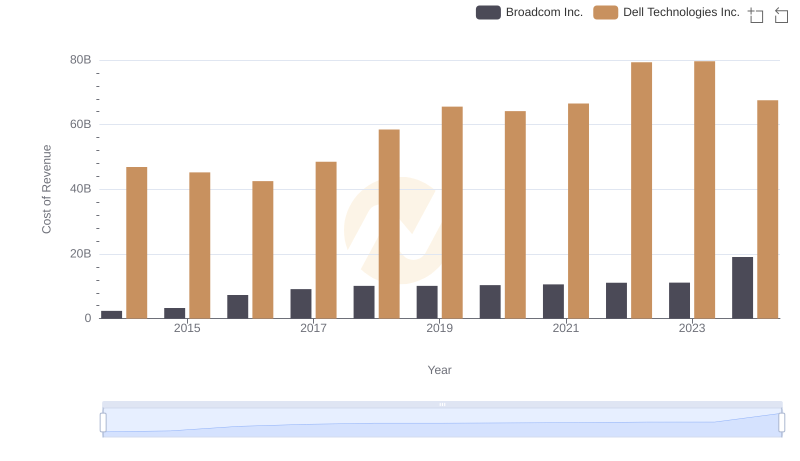
Cost Insights: Breaking Down Broadcom Inc. and Dell Technologies Inc.'s Expenses
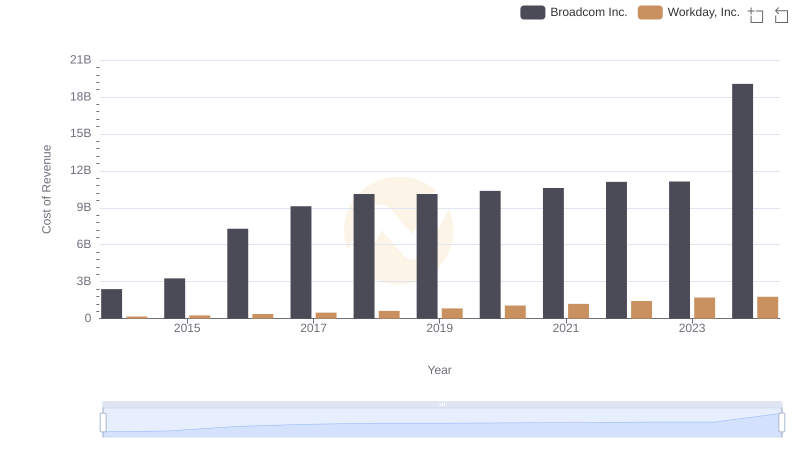
Cost Insights: Breaking Down Broadcom Inc. and Workday, Inc.'s Expenses
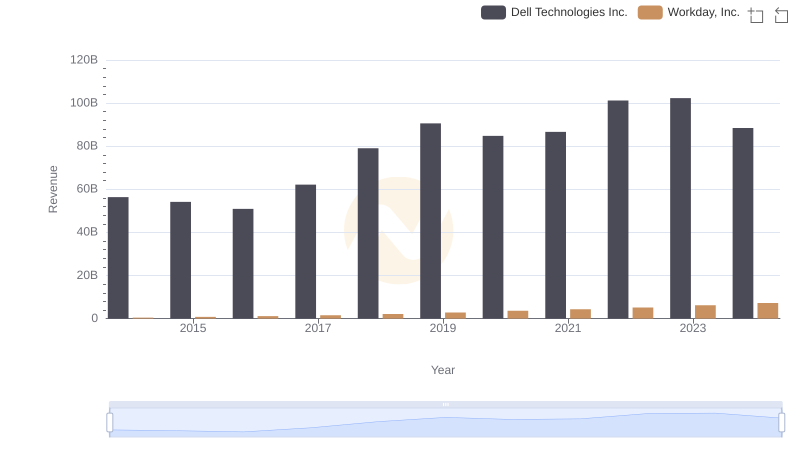
Comparing Revenue Performance: Dell Technologies Inc. or Workday, Inc.?

Gross Profit Analysis: Comparing Dell Technologies Inc. and Workday, Inc.
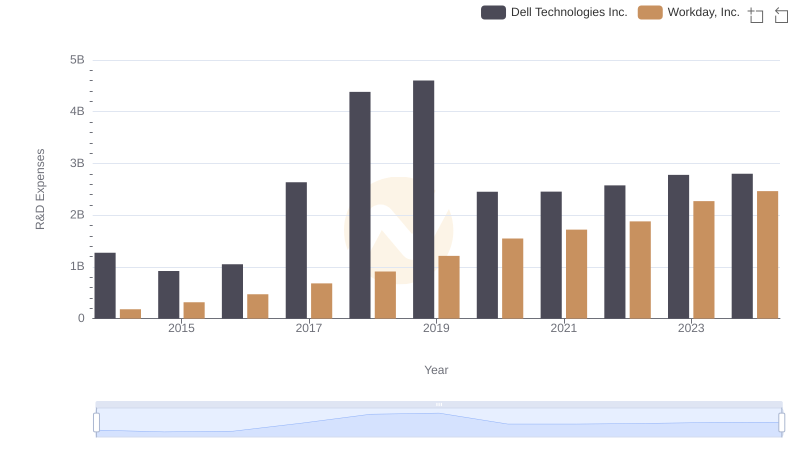
Research and Development Expenses Breakdown: Dell Technologies Inc. vs Workday, Inc.
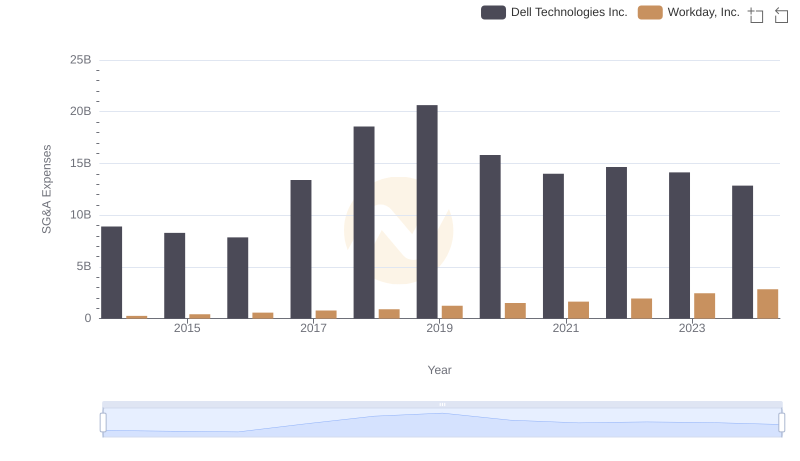
Dell Technologies Inc. or Workday, Inc.: Who Manages SG&A Costs Better?