| __timestamp | International Business Machines Corporation | Pure Storage, Inc. |
|---|---|---|
| Wednesday, January 1, 2014 | 5437000000 | 36081000 |
| Thursday, January 1, 2015 | 5247000000 | 92707000 |
| Friday, January 1, 2016 | 5726000000 | 166645000 |
| Sunday, January 1, 2017 | 5590000000 | 245817000 |
| Monday, January 1, 2018 | 5379000000 | 279196000 |
| Tuesday, January 1, 2019 | 5910000000 | 349936000 |
| Wednesday, January 1, 2020 | 6262000000 | 433662000 |
| Friday, January 1, 2021 | 6488000000 | 480467000 |
| Saturday, January 1, 2022 | 6567000000 | 581935000 |
| Sunday, January 1, 2023 | 6775000000 | 692528000 |
| Monday, January 1, 2024 | 0 | 736764000 |
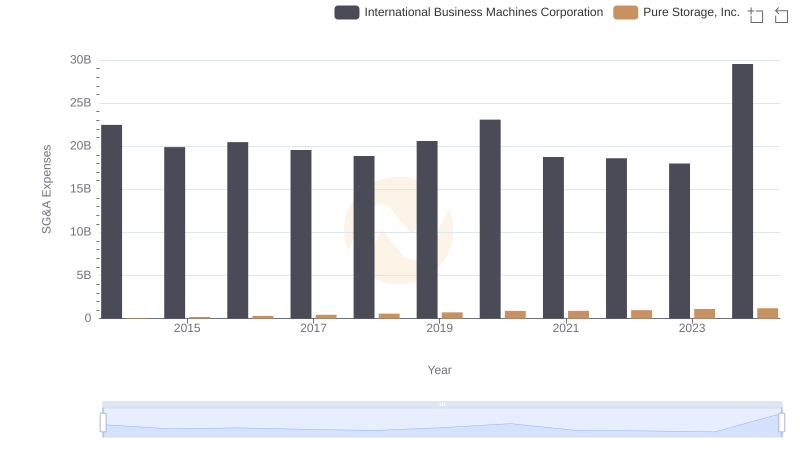
In pursuit of knowledge
In the ever-evolving tech landscape, research and development (R&D) is the lifeblood of innovation. This chart offers a fascinating glimpse into the R&D spending trends of two industry giants: International Business Machines Corporation (IBM) and Pure Storage, Inc., from 2014 to 2023.
IBM, a stalwart in the tech industry, consistently invested heavily in R&D, peaking at approximately $6.8 billion in 2023. This represents a steady increase of around 25% from 2014. In contrast, Pure Storage, a relatively newer player, demonstrated a remarkable growth trajectory, with R&D expenses skyrocketing by over 1,800% during the same period, reaching nearly $693 million in 2023.
While IBM's R&D spending dwarfs that of Pure Storage, the latter's rapid growth underscores its commitment to innovation. This comparison highlights the diverse strategies of established and emerging tech companies in driving technological advancement.

Who Generates More Revenue? International Business Machines Corporation or Pure Storage, Inc.

Cost Insights: Breaking Down International Business Machines Corporation and Pure Storage, Inc.'s Expenses
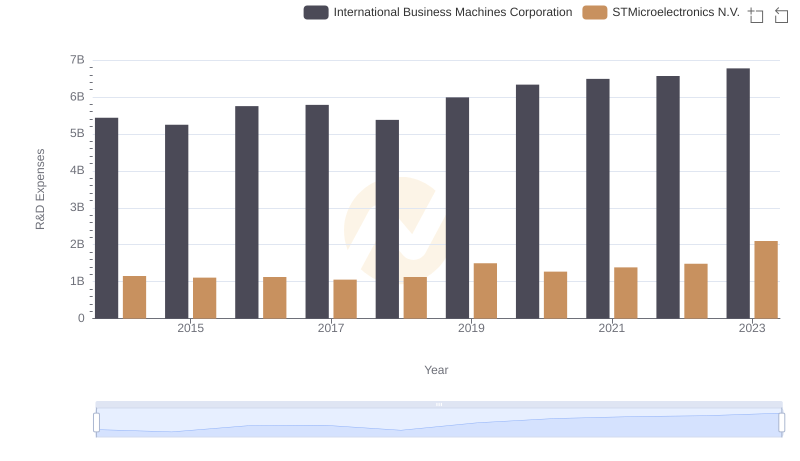
R&D Spending Showdown: International Business Machines Corporation vs STMicroelectronics N.V.
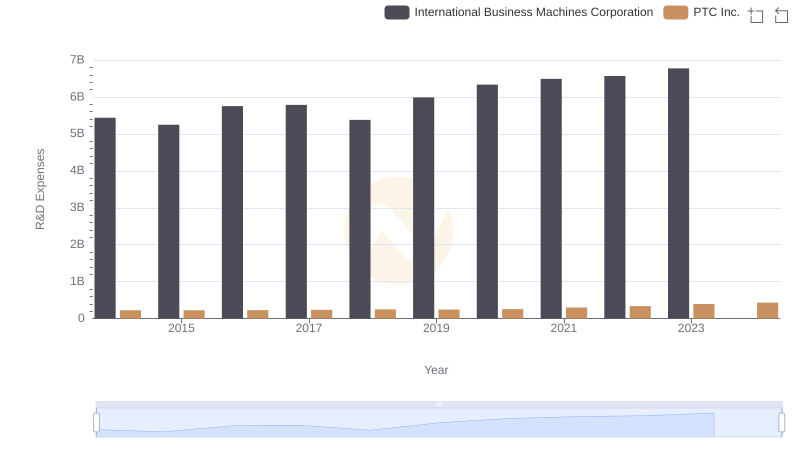
International Business Machines Corporation or PTC Inc.: Who Invests More in Innovation?
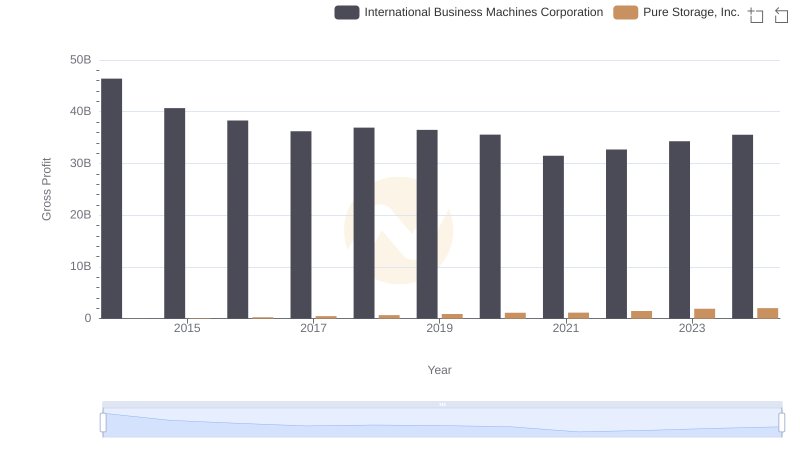
Gross Profit Trends Compared: International Business Machines Corporation vs Pure Storage, Inc.
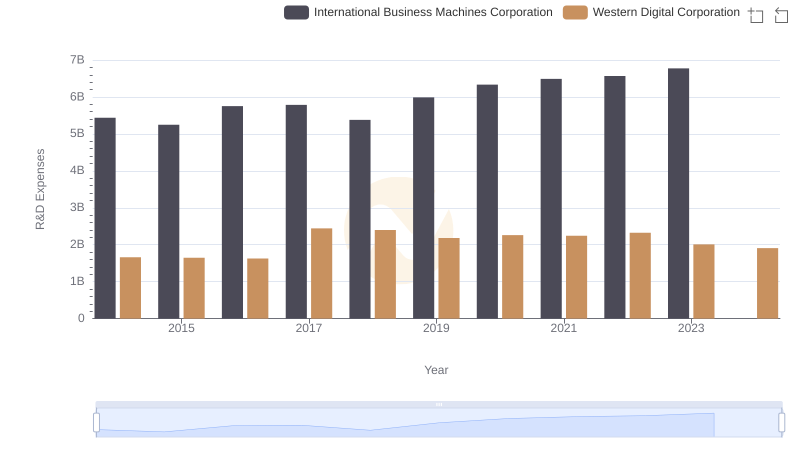
Research and Development Expenses Breakdown: International Business Machines Corporation vs Western Digital Corporation
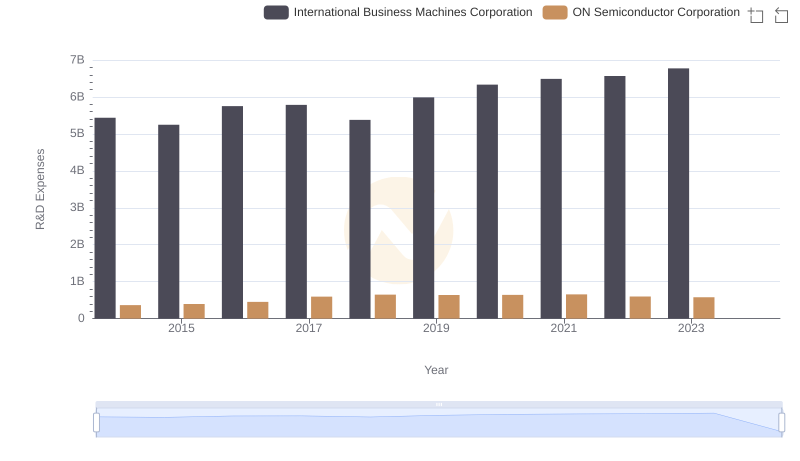
Analyzing R&D Budgets: International Business Machines Corporation vs ON Semiconductor Corporation
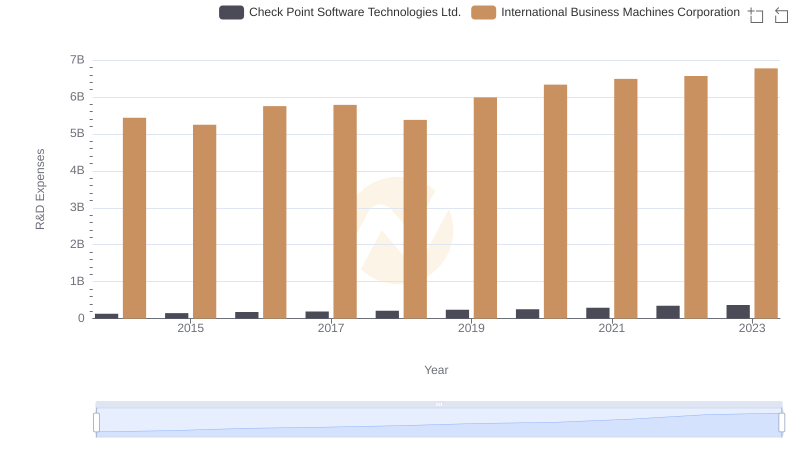
Research and Development Investment: International Business Machines Corporation vs Check Point Software Technologies Ltd.
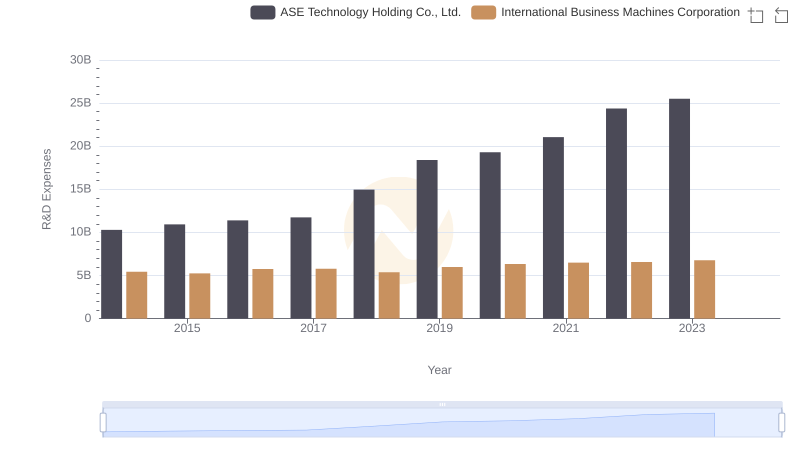
Who Prioritizes Innovation? R&D Spending Compared for International Business Machines Corporation and ASE Technology Holding Co., Ltd.
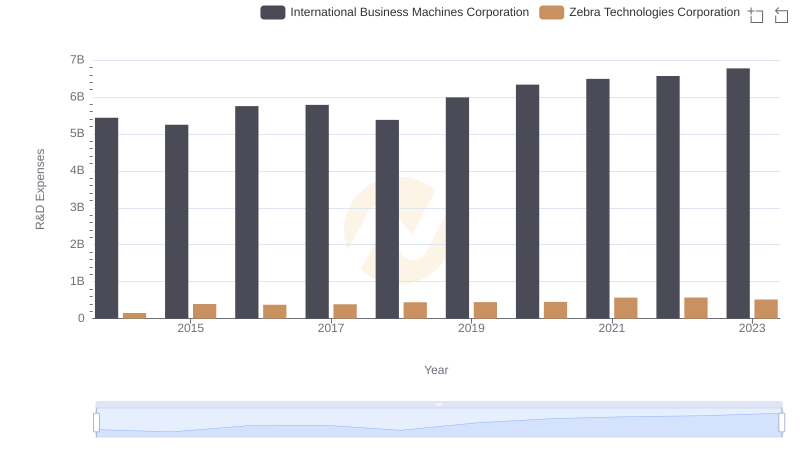
Analyzing R&D Budgets: International Business Machines Corporation vs Zebra Technologies Corporation
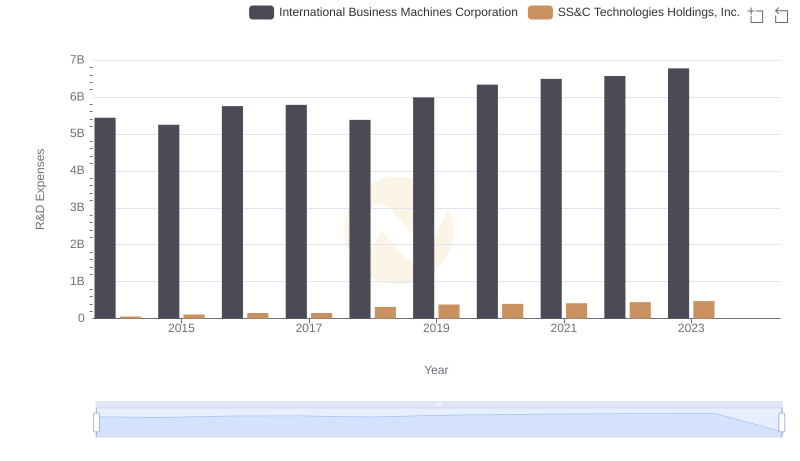
Comparing Innovation Spending: International Business Machines Corporation and SS&C Technologies Holdings, Inc.
International Business Machines Corporation or Pure Storage, Inc.: Who Manages SG&A Costs Better?