| __timestamp | Micron Technology, Inc. | VMware, Inc. |
|---|---|---|
| Wednesday, January 1, 2014 | 5188000000 | 1526000000 |
| Thursday, January 1, 2015 | 5647000000 | 1395000000 |
| Friday, January 1, 2016 | 3136000000 | 1548000000 |
| Sunday, January 1, 2017 | 9658000000 | 1819000000 |
| Monday, January 1, 2018 | 19408000000 | 2181000000 |
| Tuesday, January 1, 2019 | 12600000000 | 3495000000 |
| Wednesday, January 1, 2020 | 8827000000 | 2479000000 |
| Friday, January 1, 2021 | 12615000000 | 3646000000 |
| Saturday, January 1, 2022 | 16876000000 | 3446000000 |
| Sunday, January 1, 2023 | 2486000000 | 3273000000 |
| Monday, January 1, 2024 | 9582000000 |
Unlocking the unknown
In the ever-evolving landscape of technology, financial performance is a key indicator of a company's resilience and adaptability. Over the past decade, Micron Technology, Inc. and VMware, Inc. have showcased contrasting EBITDA trajectories. From 2014 to 2023, Micron's EBITDA surged by approximately 85%, peaking in 2018 with a remarkable 194% increase from its 2016 low. In contrast, VMware's EBITDA exhibited a steadier growth, with a notable 137% rise from 2014 to 2021, before stabilizing in recent years.
This analysis underscores the importance of strategic agility in navigating the tech industry's financial landscape.
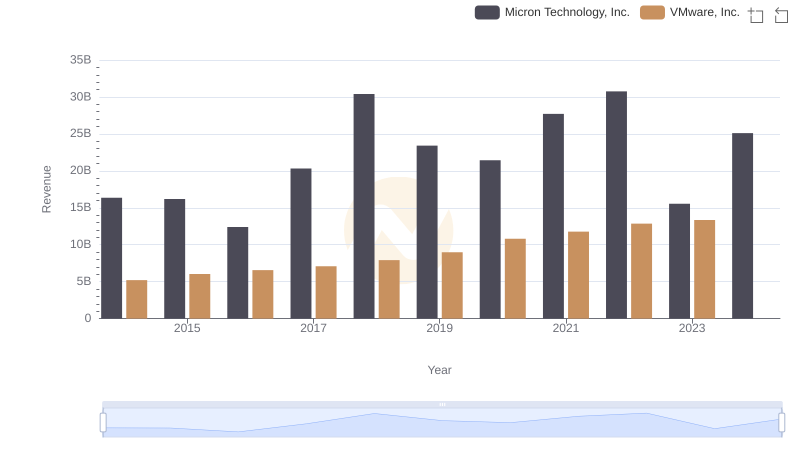
Revenue Insights: Micron Technology, Inc. and VMware, Inc. Performance Compared
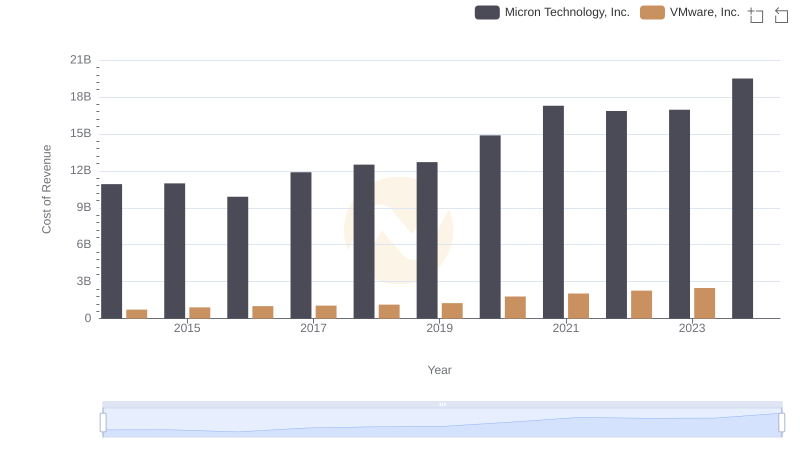
Analyzing Cost of Revenue: Micron Technology, Inc. and VMware, Inc.
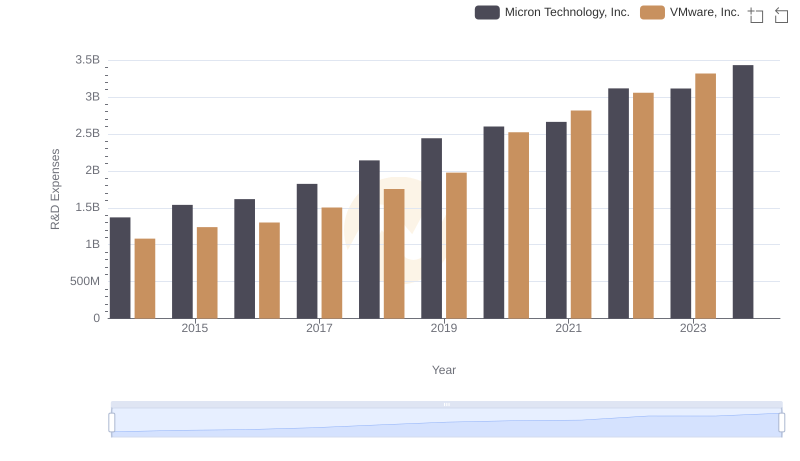
Micron Technology, Inc. or VMware, Inc.: Who Invests More in Innovation?
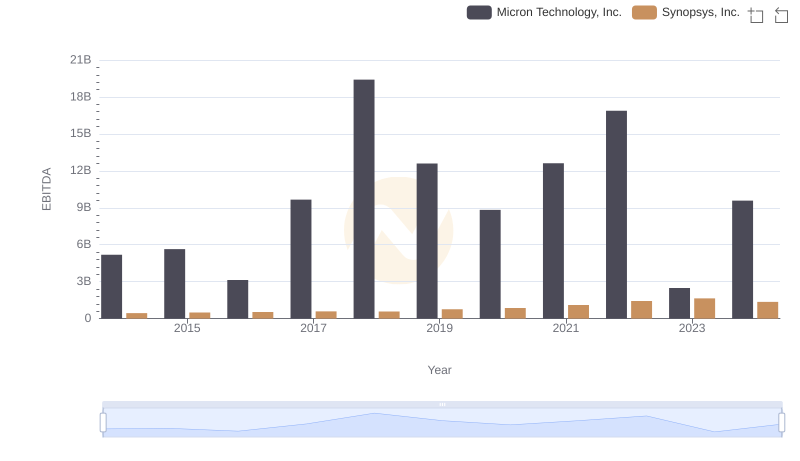
Comprehensive EBITDA Comparison: Micron Technology, Inc. vs Synopsys, Inc.
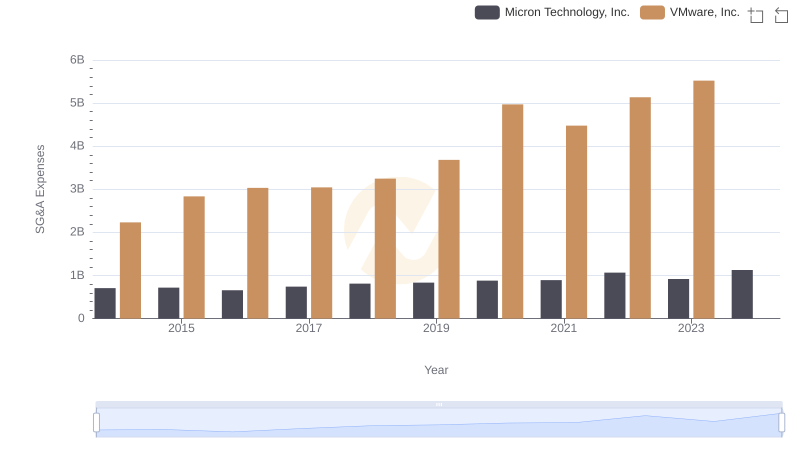
Breaking Down SG&A Expenses: Micron Technology, Inc. vs VMware, Inc.
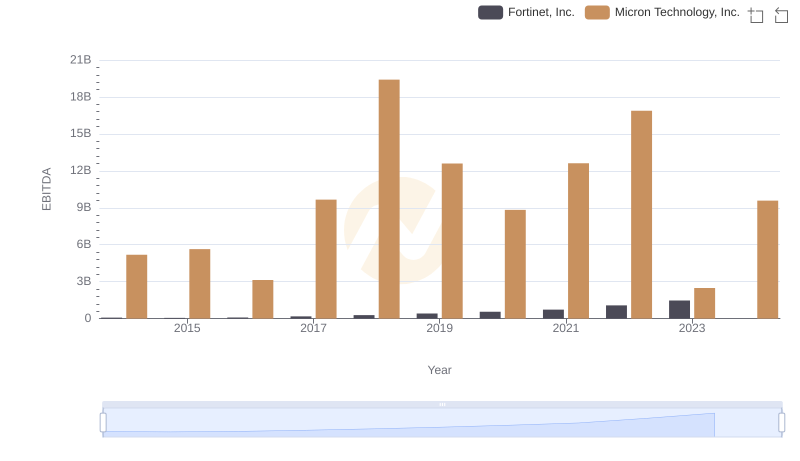
Micron Technology, Inc. and Fortinet, Inc.: A Detailed Examination of EBITDA Performance
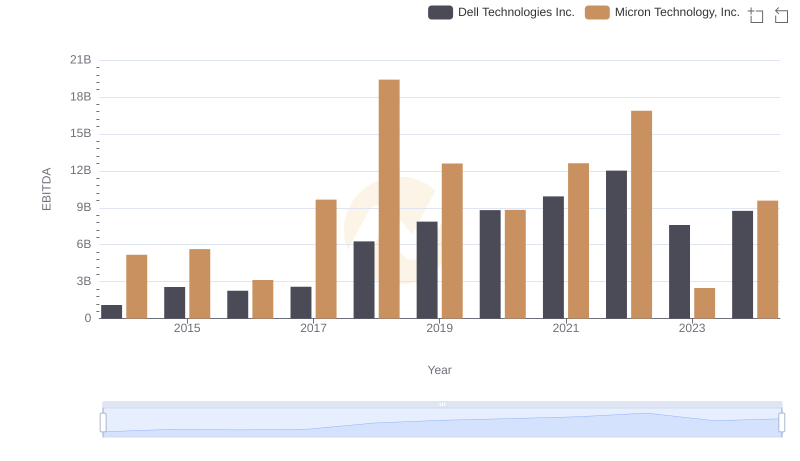
Professional EBITDA Benchmarking: Micron Technology, Inc. vs Dell Technologies Inc.
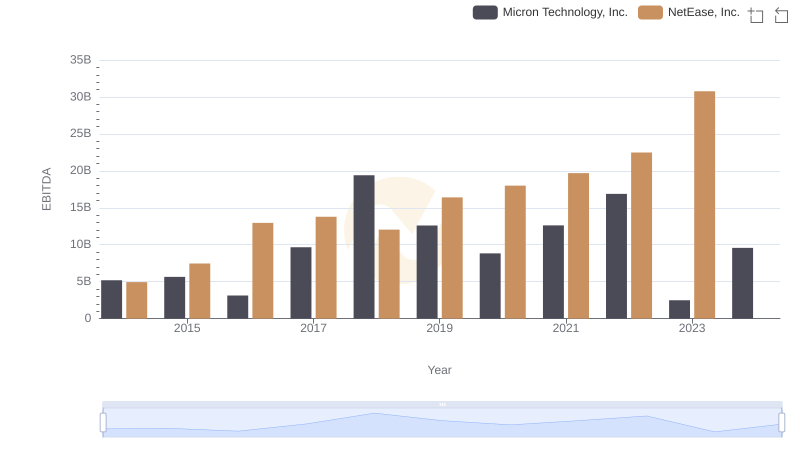
Comprehensive EBITDA Comparison: Micron Technology, Inc. vs NetEase, Inc.
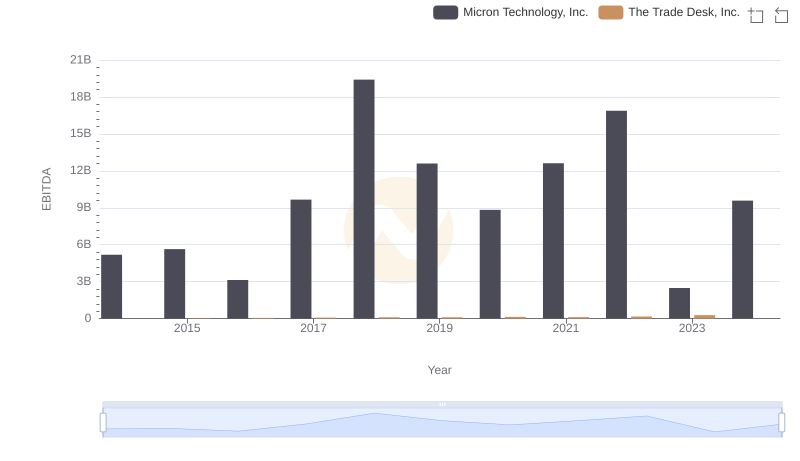
Comparative EBITDA Analysis: Micron Technology, Inc. vs The Trade Desk, Inc.
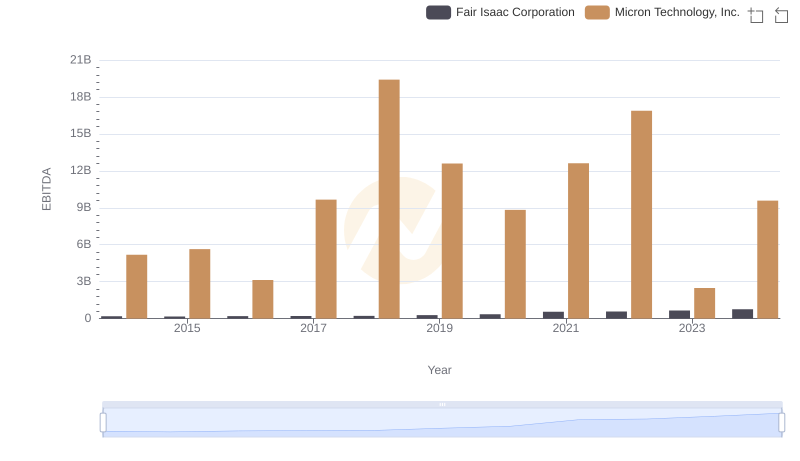
A Side-by-Side Analysis of EBITDA: Micron Technology, Inc. and Fair Isaac Corporation
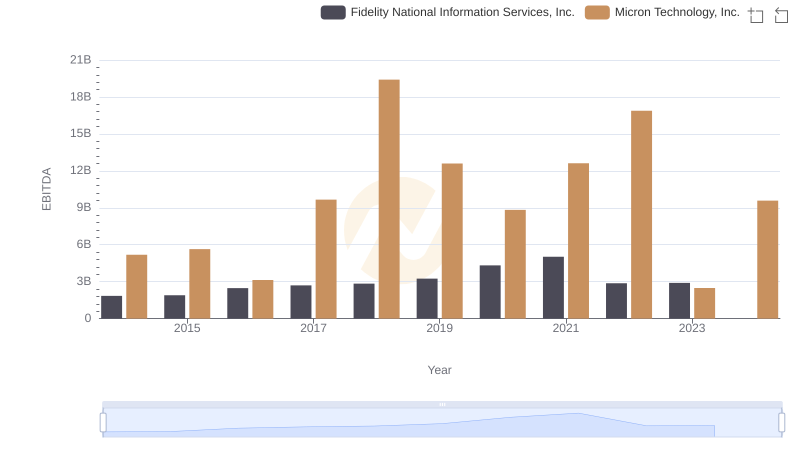
EBITDA Performance Review: Micron Technology, Inc. vs Fidelity National Information Services, Inc.
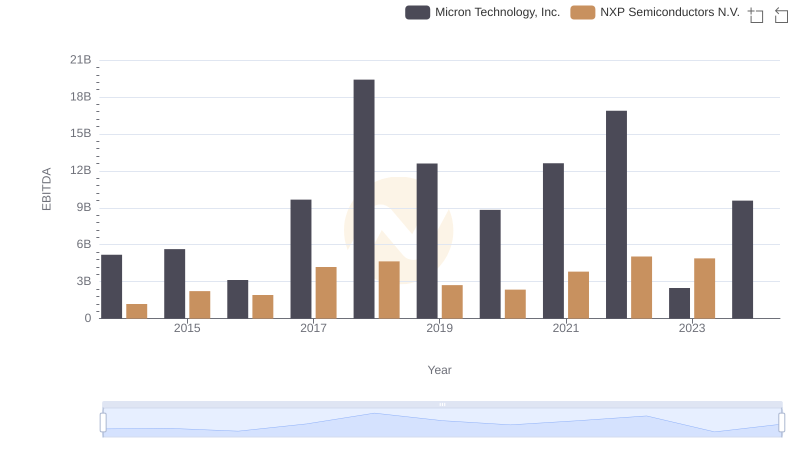
EBITDA Metrics Evaluated: Micron Technology, Inc. vs NXP Semiconductors N.V.