| __timestamp | Micron Technology, Inc. | The Trade Desk, Inc. |
|---|---|---|
| Wednesday, January 1, 2014 | 5188000000 | 580000 |
| Thursday, January 1, 2015 | 5647000000 | 32824000 |
| Friday, January 1, 2016 | 3136000000 | 61316000 |
| Sunday, January 1, 2017 | 9658000000 | 76565000 |
| Monday, January 1, 2018 | 19408000000 | 107323000 |
| Tuesday, January 1, 2019 | 12600000000 | 112196000 |
| Wednesday, January 1, 2020 | 8827000000 | 144208000 |
| Friday, January 1, 2021 | 12615000000 | 124817000 |
| Saturday, January 1, 2022 | 16876000000 | 168079000 |
| Sunday, January 1, 2023 | 2486000000 | 280898000 |
| Monday, January 1, 2024 | 9582000000 | 427167000 |
Unleashing the power of data
In the ever-evolving landscape of technology, Micron Technology, Inc. and The Trade Desk, Inc. have carved distinct paths. Over the past decade, Micron's EBITDA has shown a remarkable journey, peaking in 2018 with a staggering 1,940% increase from its 2014 figures. However, 2023 saw a dip, reflecting the volatile nature of the semiconductor industry. In contrast, The Trade Desk, a leader in digital advertising, has consistently grown its EBITDA, achieving a 484% increase from 2014 to 2023. Despite missing data for 2024, the trend suggests resilience and adaptability. This comparative analysis highlights the contrasting dynamics of hardware and digital advertising sectors, offering insights into their financial health and strategic directions.
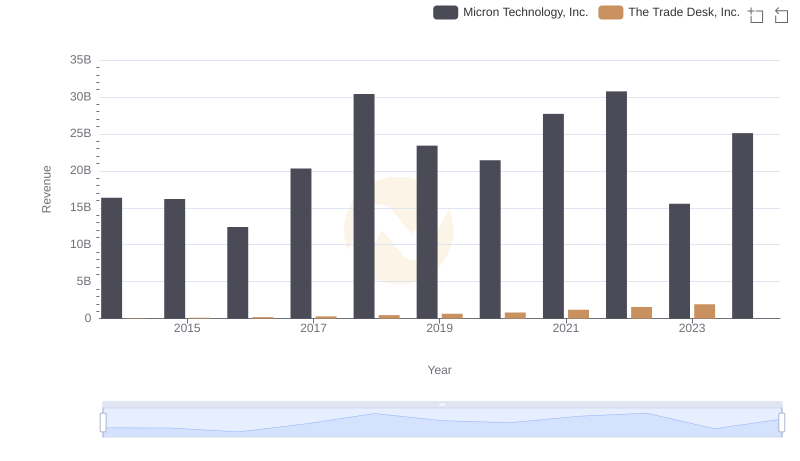
Comparing Revenue Performance: Micron Technology, Inc. or The Trade Desk, Inc.?
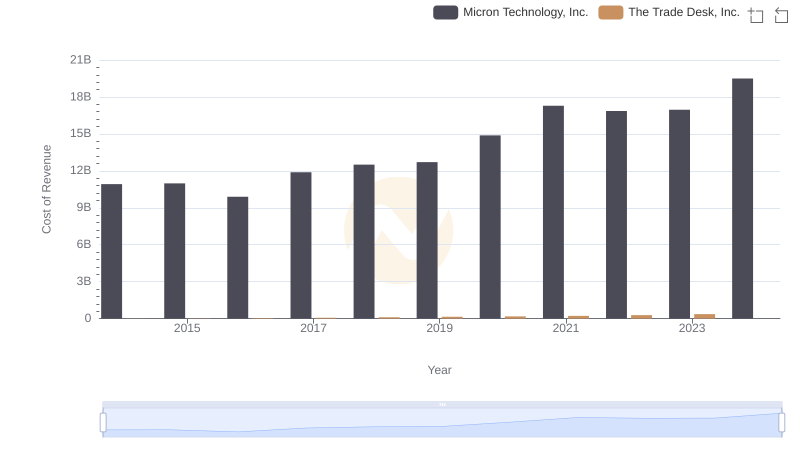
Cost of Revenue: Key Insights for Micron Technology, Inc. and The Trade Desk, Inc.
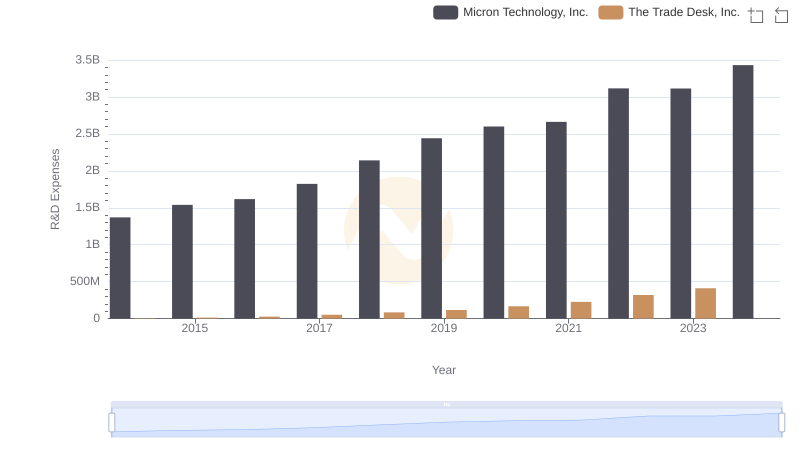
R&D Spending Showdown: Micron Technology, Inc. vs The Trade Desk, Inc.
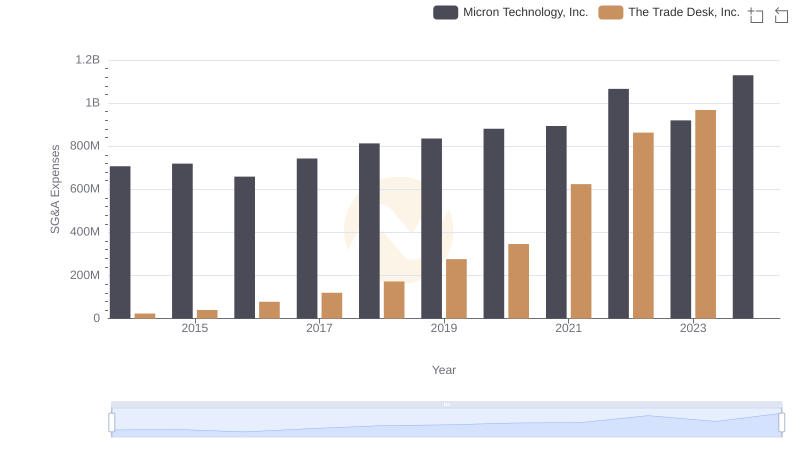
Cost Management Insights: SG&A Expenses for Micron Technology, Inc. and The Trade Desk, Inc.
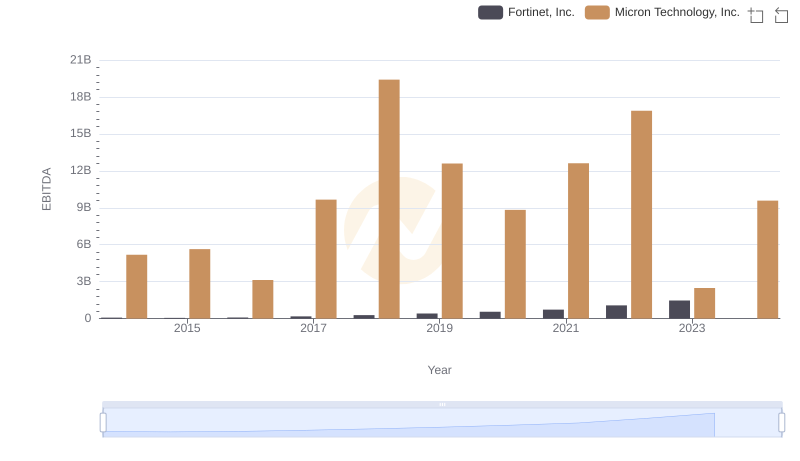
Micron Technology, Inc. and Fortinet, Inc.: A Detailed Examination of EBITDA Performance
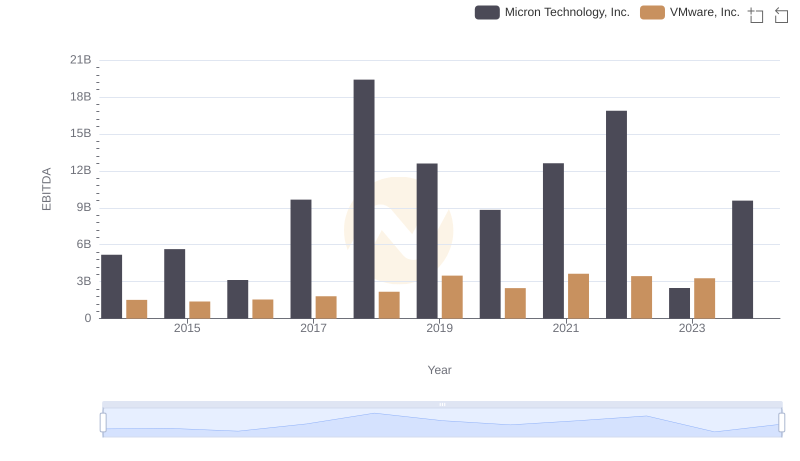
Professional EBITDA Benchmarking: Micron Technology, Inc. vs VMware, Inc.
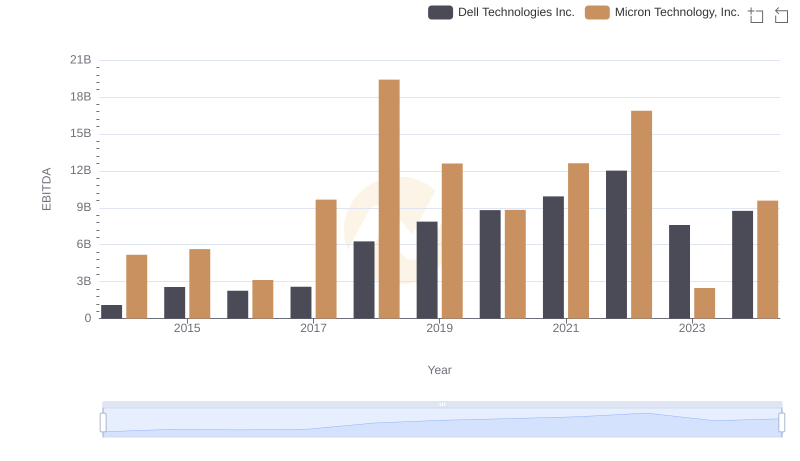
Professional EBITDA Benchmarking: Micron Technology, Inc. vs Dell Technologies Inc.
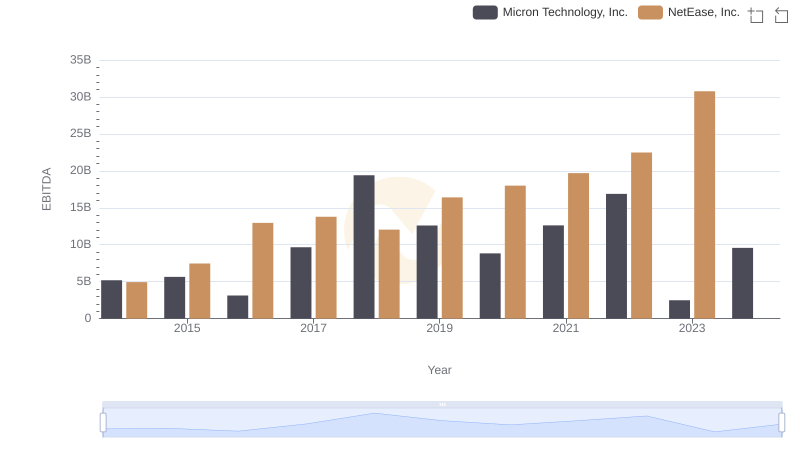
Comprehensive EBITDA Comparison: Micron Technology, Inc. vs NetEase, Inc.
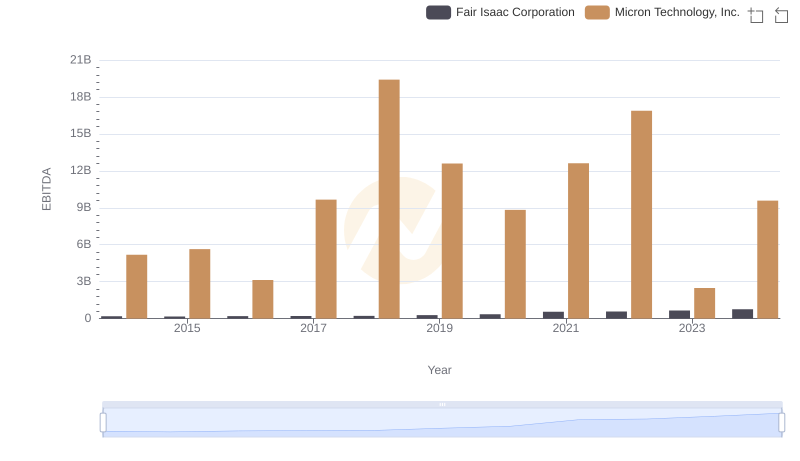
A Side-by-Side Analysis of EBITDA: Micron Technology, Inc. and Fair Isaac Corporation
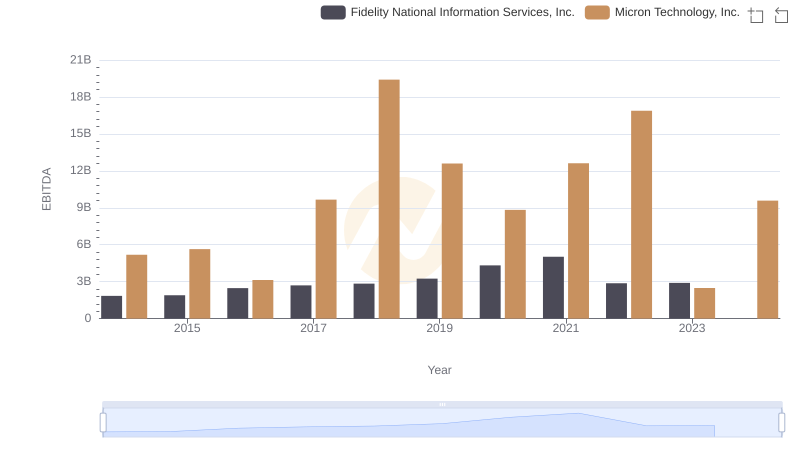
EBITDA Performance Review: Micron Technology, Inc. vs Fidelity National Information Services, Inc.
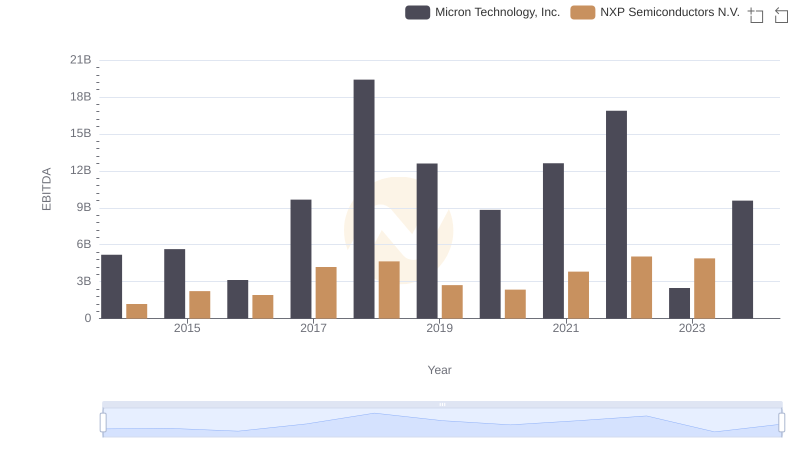
EBITDA Metrics Evaluated: Micron Technology, Inc. vs NXP Semiconductors N.V.
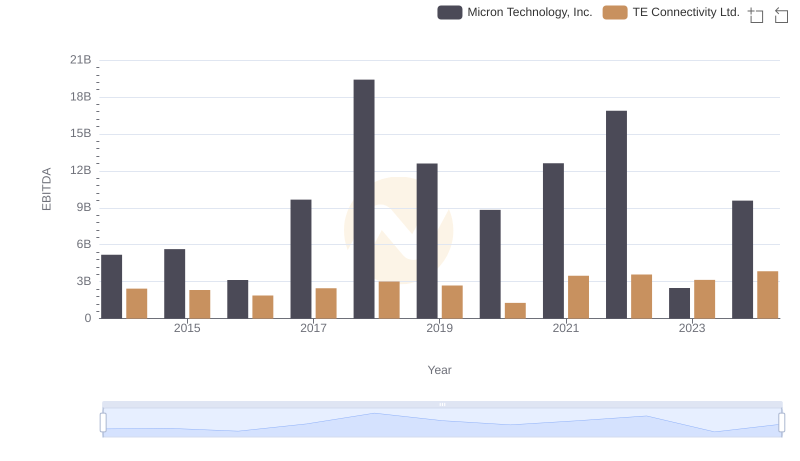
Micron Technology, Inc. and TE Connectivity Ltd.: A Detailed Examination of EBITDA Performance