| __timestamp | Motorola Solutions, Inc. | Nokia Oyj |
|---|---|---|
| Wednesday, January 1, 2014 | 1184000000 | 1634000000 |
| Thursday, January 1, 2015 | 1021000000 | 1651000000 |
| Friday, January 1, 2016 | 1000000000 | 3819000000 |
| Sunday, January 1, 2017 | 979000000 | 3615000000 |
| Monday, January 1, 2018 | 1254000000 | 3463000000 |
| Tuesday, January 1, 2019 | 1403000000 | 3101000000 |
| Wednesday, January 1, 2020 | 1293000000 | 2898000000 |
| Friday, January 1, 2021 | 1353000000 | 2792000000 |
| Saturday, January 1, 2022 | 1450000000 | 3013000000 |
| Sunday, January 1, 2023 | 1561000000 | 2929000000 |
| Monday, January 1, 2024 | 1752000000 |
Cracking the code
In the ever-evolving tech industry, understanding the financial strategies of major players is crucial. Over the past decade, Motorola Solutions, Inc. and Nokia Oyj have demonstrated distinct approaches to their Selling, General, and Administrative (SG&A) expenses. From 2014 to 2023, Nokia consistently outspent Motorola, with an average SG&A expense nearly 130% higher. However, Motorola's spending has shown a steady upward trend, peaking at $1.56 billion in 2023, a 32% increase from 2014. In contrast, Nokia's expenses fluctuated, reaching a high of $3.82 billion in 2016 before stabilizing around $2.93 billion in 2023. This divergence highlights Motorola's strategic investment in operational efficiency, while Nokia's variable spending reflects its adaptive market strategies. As these giants navigate the competitive landscape, their SG&A patterns offer valuable insights into their corporate priorities and market positioning.
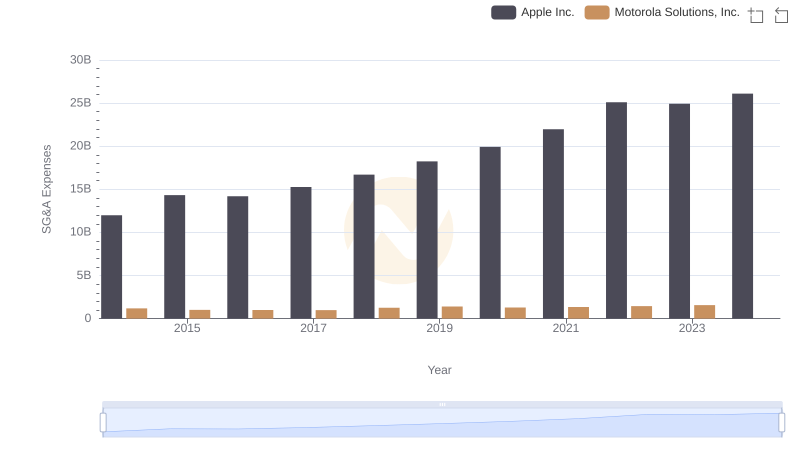
Apple Inc. or Motorola Solutions, Inc.: Who Manages SG&A Costs Better?
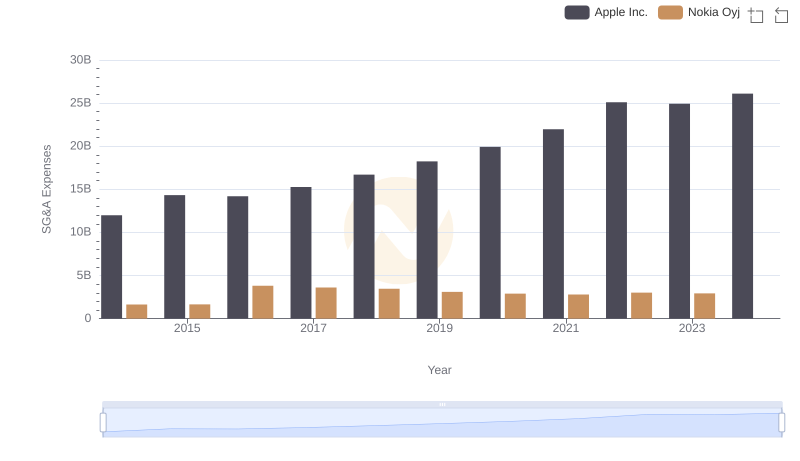
SG&A Efficiency Analysis: Comparing Apple Inc. and Nokia Oyj
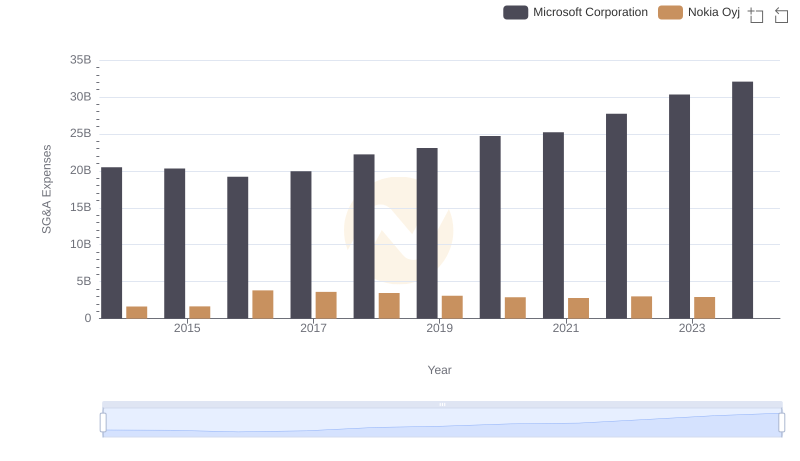
Selling, General, and Administrative Costs: Microsoft Corporation vs Nokia Oyj
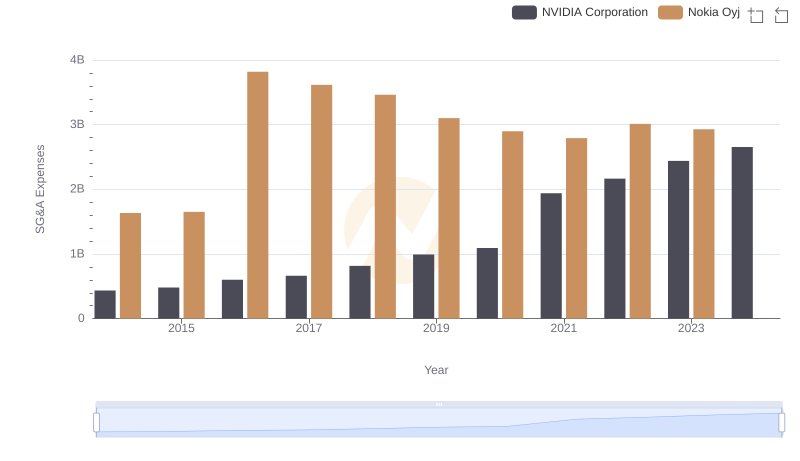
Selling, General, and Administrative Costs: NVIDIA Corporation vs Nokia Oyj
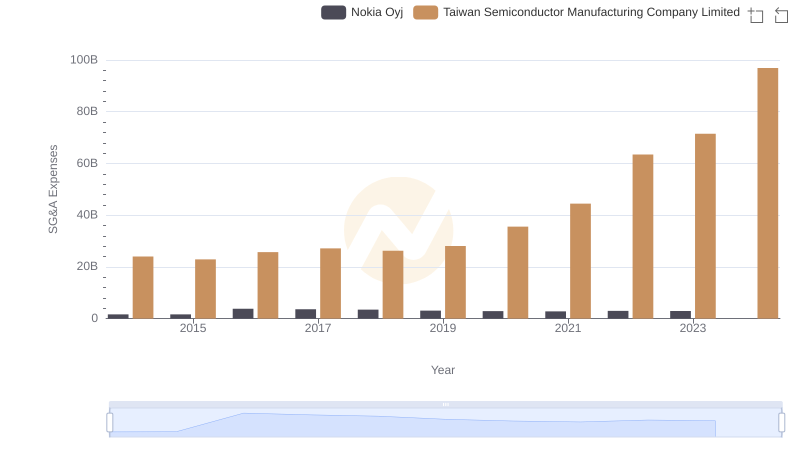
Breaking Down SG&A Expenses: Taiwan Semiconductor Manufacturing Company Limited vs Nokia Oyj
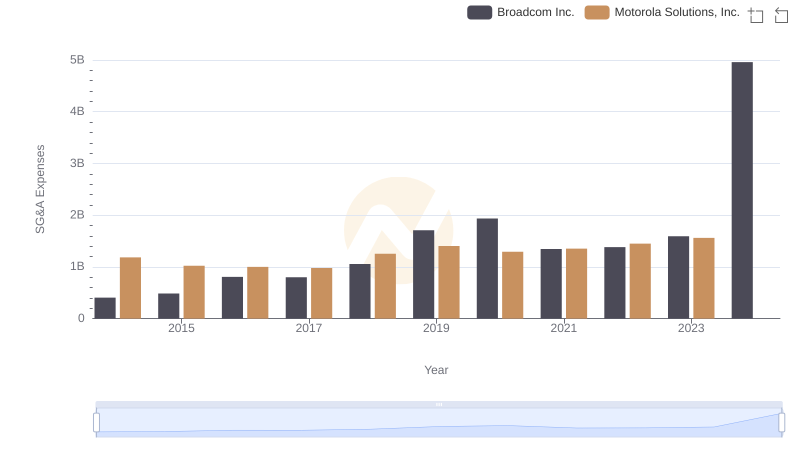
Cost Management Insights: SG&A Expenses for Broadcom Inc. and Motorola Solutions, Inc.
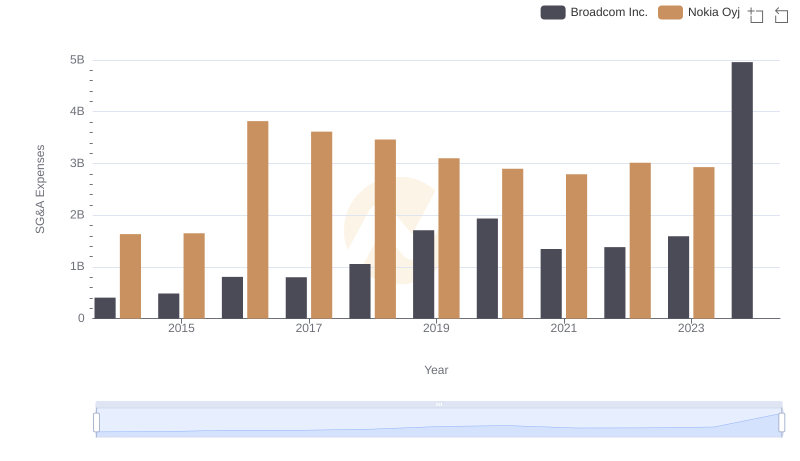
Operational Costs Compared: SG&A Analysis of Broadcom Inc. and Nokia Oyj
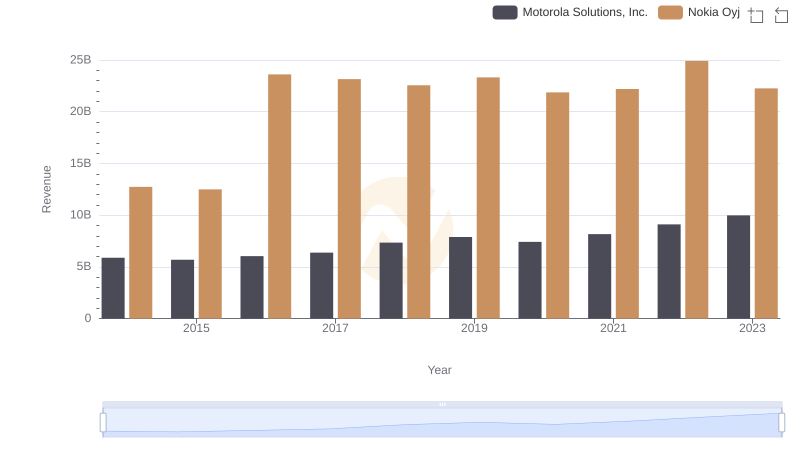
Comparing Revenue Performance: Motorola Solutions, Inc. or Nokia Oyj?
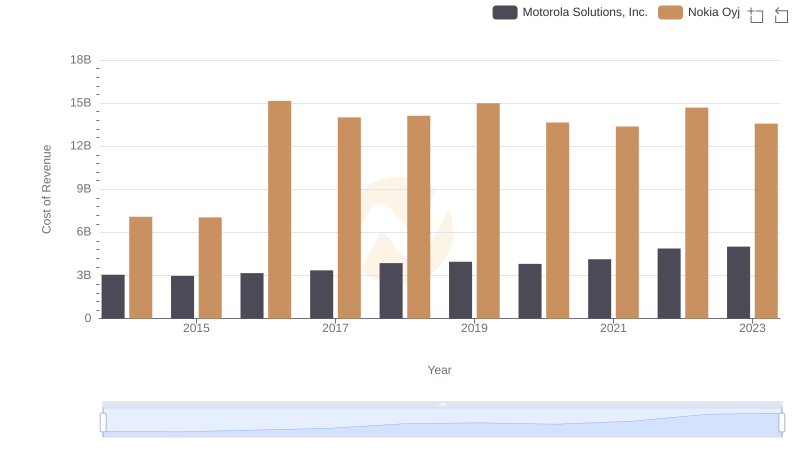
Cost of Revenue Trends: Motorola Solutions, Inc. vs Nokia Oyj
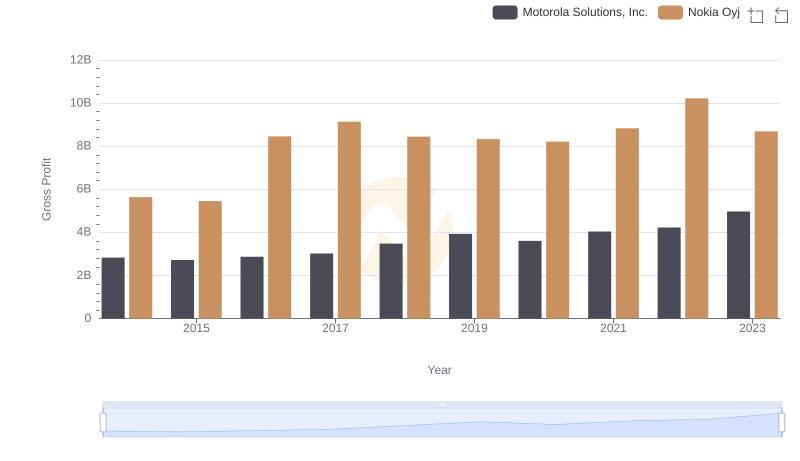
Key Insights on Gross Profit: Motorola Solutions, Inc. vs Nokia Oyj
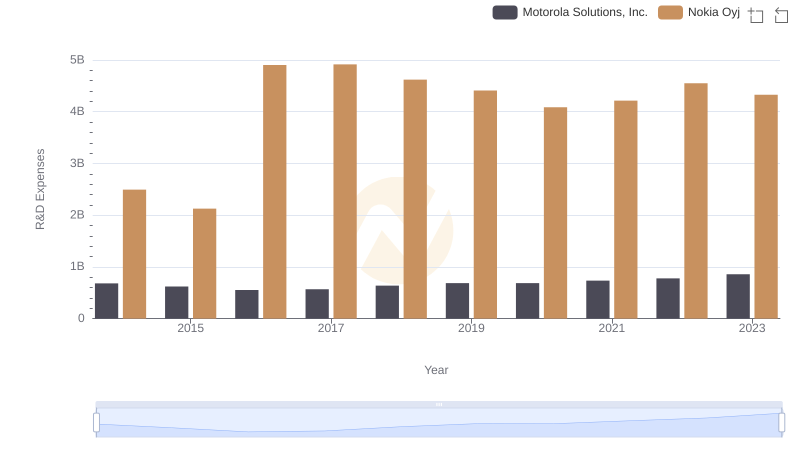
Motorola Solutions, Inc. or Nokia Oyj: Who Invests More in Innovation?