| __timestamp | Motorola Solutions, Inc. | Nokia Oyj |
|---|---|---|
| Wednesday, January 1, 2014 | 2831000000 | 5638000000 |
| Thursday, January 1, 2015 | 2719000000 | 5454000000 |
| Friday, January 1, 2016 | 2869000000 | 8457000000 |
| Sunday, January 1, 2017 | 3024000000 | 9138000000 |
| Monday, January 1, 2018 | 3480000000 | 8446000000 |
| Tuesday, January 1, 2019 | 3931000000 | 8326000000 |
| Wednesday, January 1, 2020 | 3608000000 | 8214000000 |
| Friday, January 1, 2021 | 4040000000 | 8834000000 |
| Saturday, January 1, 2022 | 4229000000 | 10222000000 |
| Sunday, January 1, 2023 | 4970000000 | 8687000000 |
| Monday, January 1, 2024 | 5512000000 |
Unveiling the hidden dimensions of data
In the ever-evolving landscape of telecommunications, Motorola Solutions and Nokia Oyj have been pivotal players. From 2014 to 2023, these industry titans have showcased contrasting trajectories in gross profit. Motorola Solutions, Inc. has seen a remarkable growth of approximately 76% in gross profit, peaking at nearly $5 billion in 2023. This upward trend highlights their strategic innovations and market adaptability. Meanwhile, Nokia Oyj, despite a robust start with a gross profit of over $5.6 billion in 2014, experienced fluctuations, culminating in a 2022 peak of over $10 billion before a slight dip in 2023. This dynamic reflects Nokia's resilience amidst market challenges. As we delve into these insights, it becomes evident that both companies, while navigating different paths, continue to shape the future of global telecommunications.

Gross Profit Analysis: Comparing Apple Inc. and Nokia Oyj
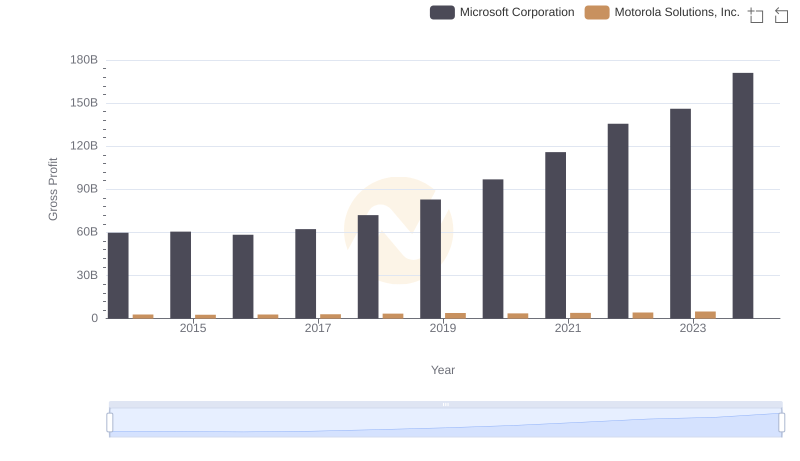
Key Insights on Gross Profit: Microsoft Corporation vs Motorola Solutions, Inc.
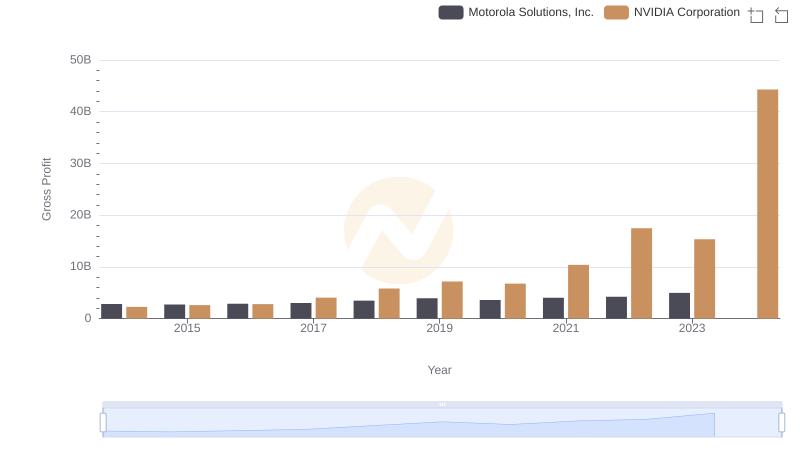
NVIDIA Corporation vs Motorola Solutions, Inc.: A Gross Profit Performance Breakdown
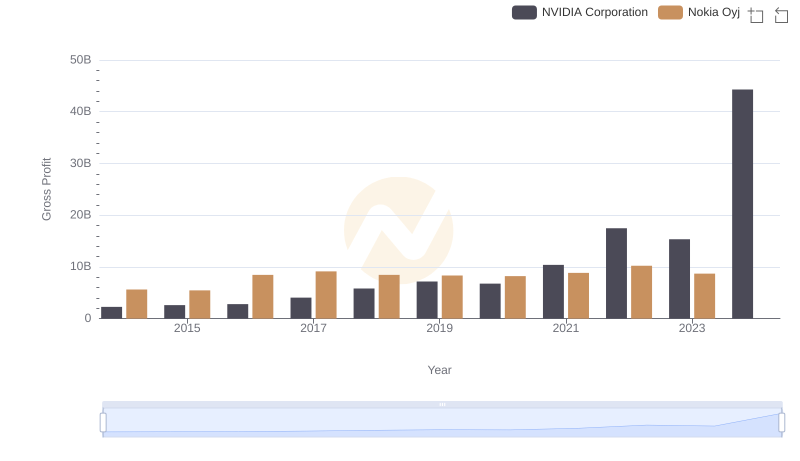
Key Insights on Gross Profit: NVIDIA Corporation vs Nokia Oyj
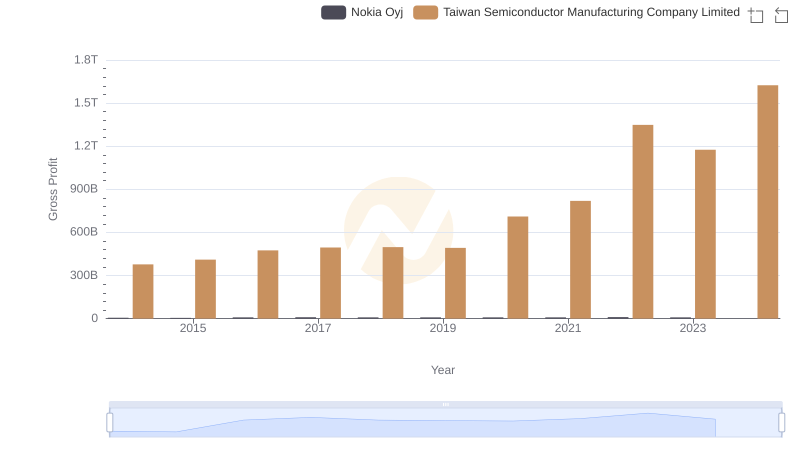
Taiwan Semiconductor Manufacturing Company Limited and Nokia Oyj: A Detailed Gross Profit Analysis
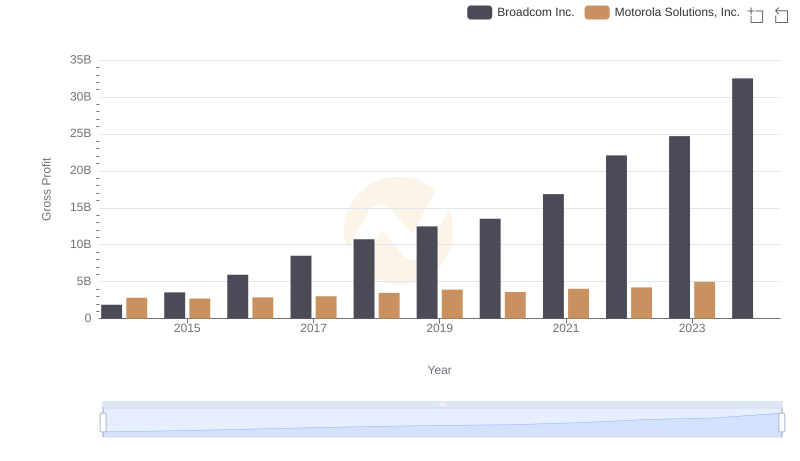
Key Insights on Gross Profit: Broadcom Inc. vs Motorola Solutions, Inc.
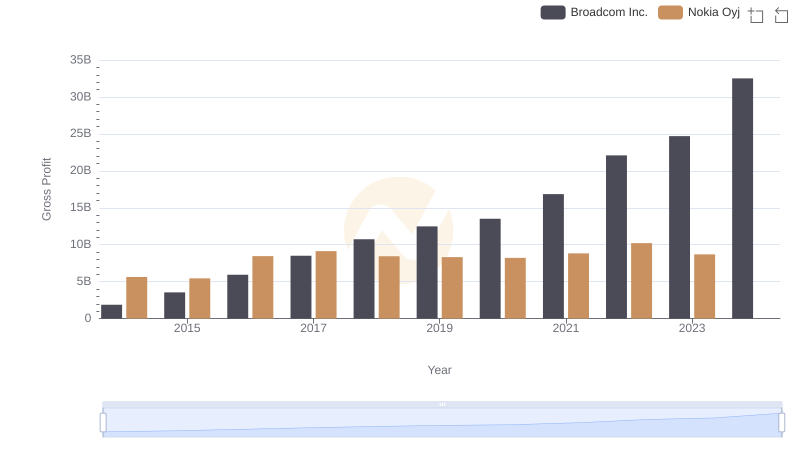
Gross Profit Comparison: Broadcom Inc. and Nokia Oyj Trends
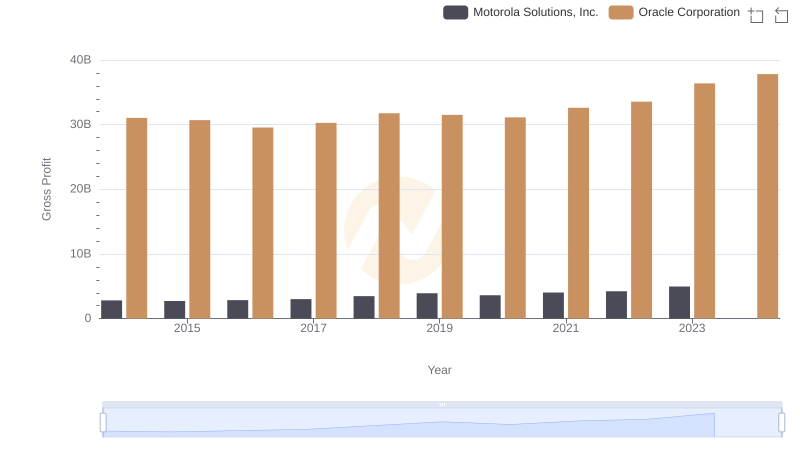
Oracle Corporation and Motorola Solutions, Inc.: A Detailed Gross Profit Analysis
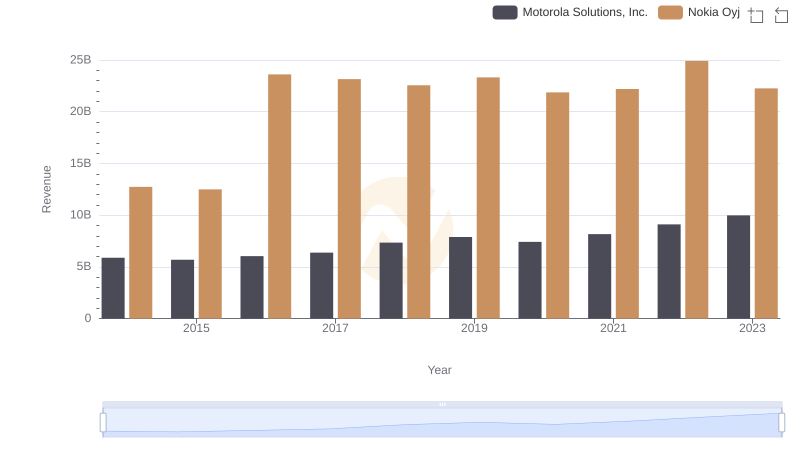
Comparing Revenue Performance: Motorola Solutions, Inc. or Nokia Oyj?
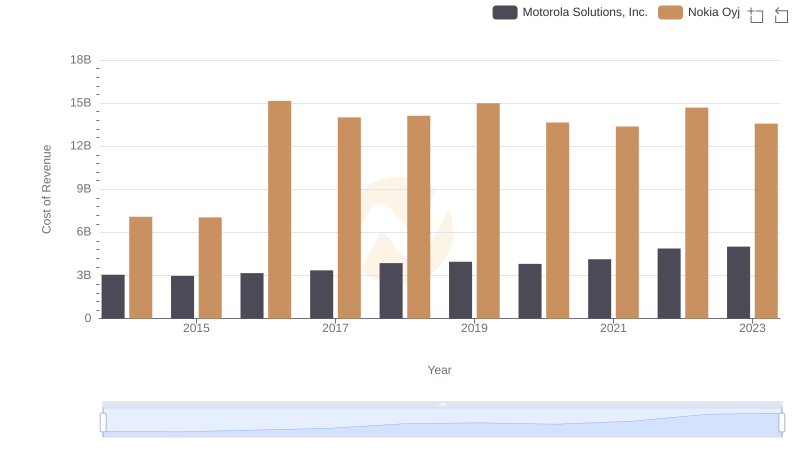
Cost of Revenue Trends: Motorola Solutions, Inc. vs Nokia Oyj
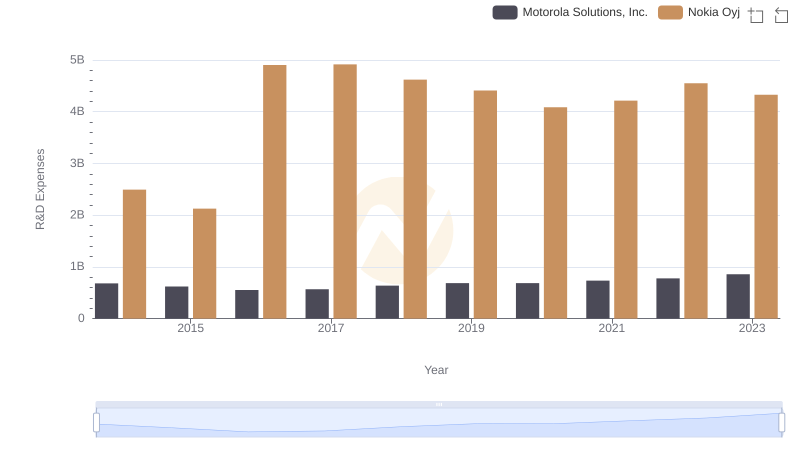
Motorola Solutions, Inc. or Nokia Oyj: Who Invests More in Innovation?
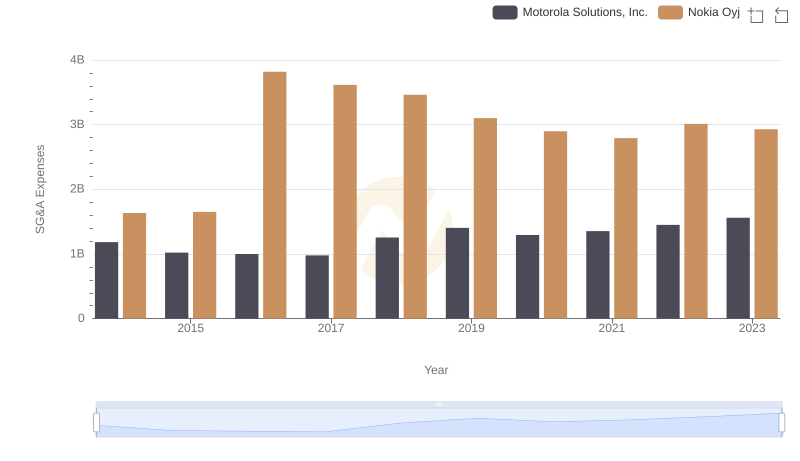
Motorola Solutions, Inc. and Nokia Oyj: SG&A Spending Patterns Compared