| __timestamp | Monolithic Power Systems, Inc. | Zebra Technologies Corporation |
|---|---|---|
| Wednesday, January 1, 2014 | 66755000 | 351518000 |
| Thursday, January 1, 2015 | 72312000 | 763025000 |
| Friday, January 1, 2016 | 83012000 | 751000000 |
| Sunday, January 1, 2017 | 97257000 | 749000000 |
| Monday, January 1, 2018 | 113803000 | 811000000 |
| Tuesday, January 1, 2019 | 133542000 | 826000000 |
| Wednesday, January 1, 2020 | 161670000 | 787000000 |
| Friday, January 1, 2021 | 226190000 | 935000000 |
| Saturday, January 1, 2022 | 273595000 | 982000000 |
| Sunday, January 1, 2023 | 275740000 | 915000000 |
| Monday, January 1, 2024 | 981000000 |
Unveiling the hidden dimensions of data
In the ever-evolving landscape of technology, Monolithic Power Systems, Inc. and Zebra Technologies Corporation have carved distinct paths. From 2014 to 2023, these companies have shown remarkable trends in their Selling, General, and Administrative (SG&A) expenses, reflecting their strategic priorities and market dynamics.
Monolithic Power Systems, Inc. has seen a consistent rise in SG&A expenses, growing by over 300% from 2014 to 2023. This increase underscores their aggressive expansion and investment in innovation. In contrast, Zebra Technologies Corporation, while maintaining a higher absolute SG&A expense, has shown a steadier growth rate of approximately 160% over the same period, indicating a more measured approach to scaling operations.
These trends highlight the contrasting strategies of two tech giants, offering insights into their operational focus and market positioning. As the tech industry continues to evolve, understanding these financial dynamics is crucial for investors and analysts alike.
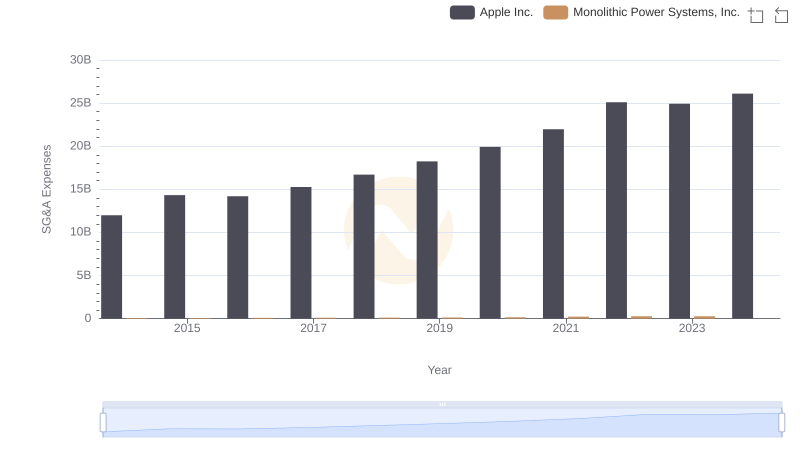
Operational Costs Compared: SG&A Analysis of Apple Inc. and Monolithic Power Systems, Inc.
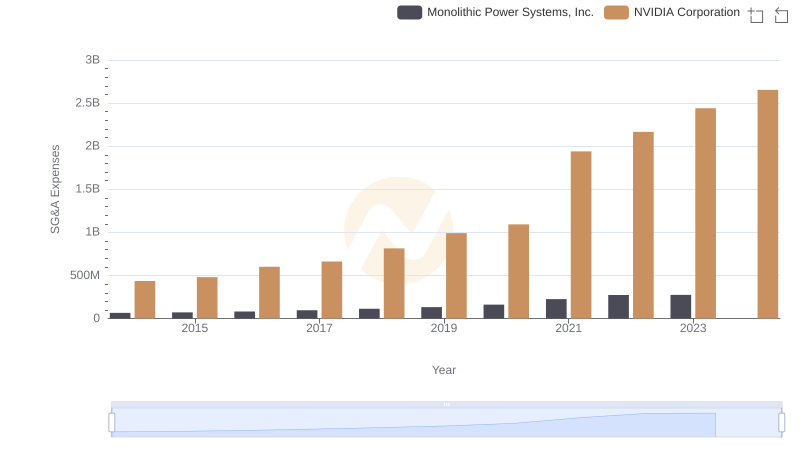
SG&A Efficiency Analysis: Comparing NVIDIA Corporation and Monolithic Power Systems, Inc.
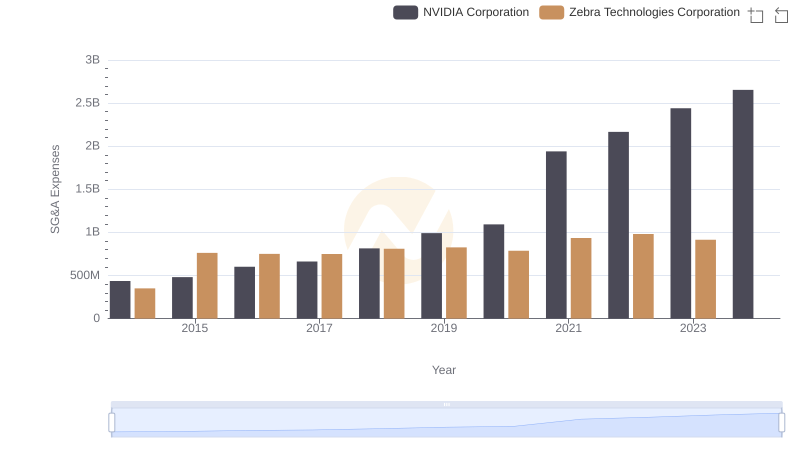
Who Optimizes SG&A Costs Better? NVIDIA Corporation or Zebra Technologies Corporation
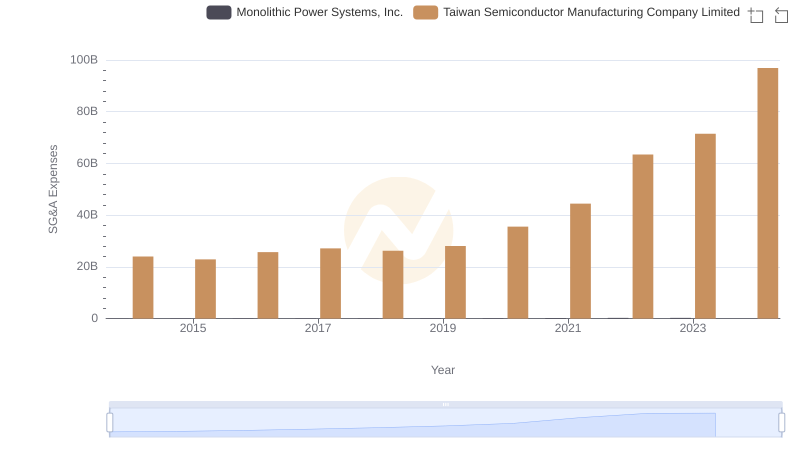
Breaking Down SG&A Expenses: Taiwan Semiconductor Manufacturing Company Limited vs Monolithic Power Systems, Inc.
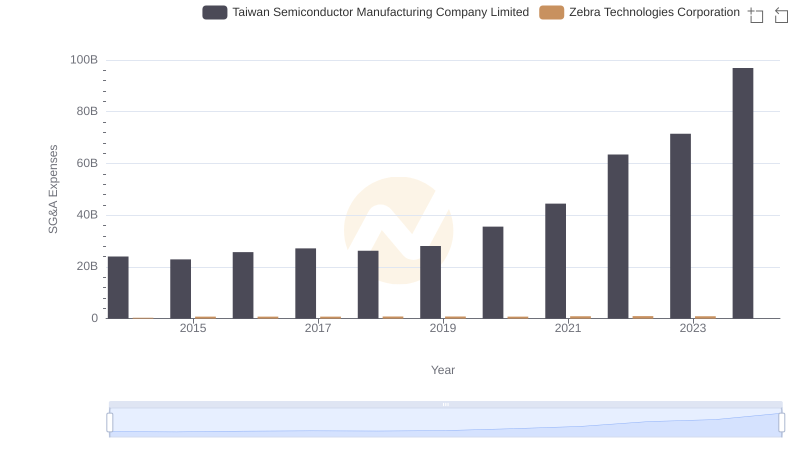
Cost Management Insights: SG&A Expenses for Taiwan Semiconductor Manufacturing Company Limited and Zebra Technologies Corporation
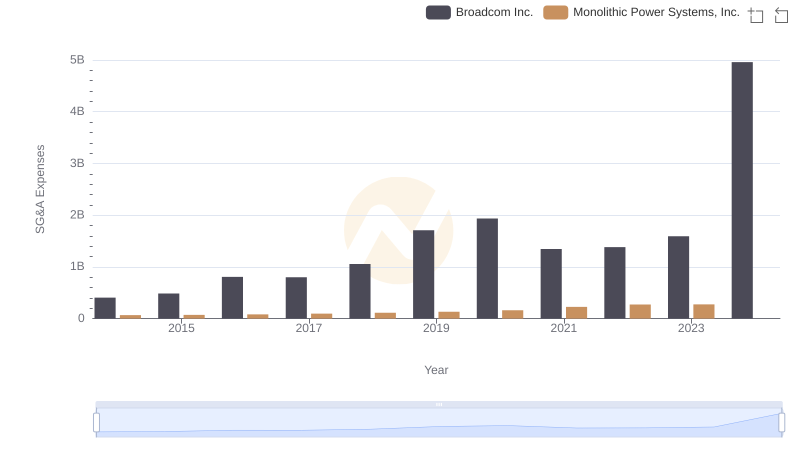
Who Optimizes SG&A Costs Better? Broadcom Inc. or Monolithic Power Systems, Inc.
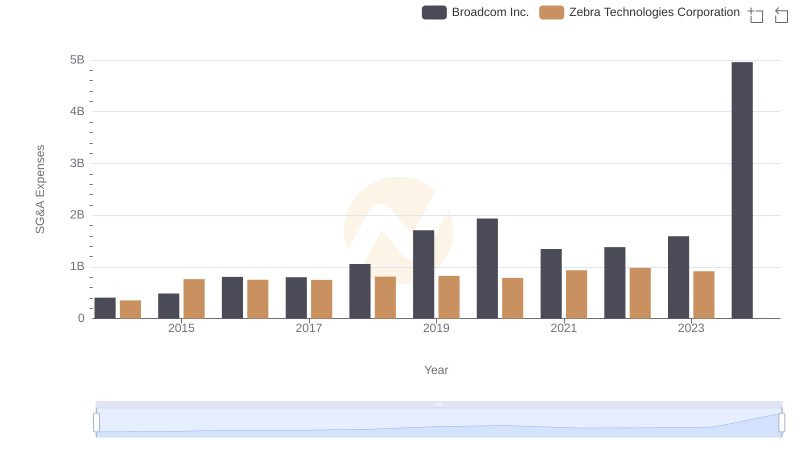
Broadcom Inc. vs Zebra Technologies Corporation: SG&A Expense Trends
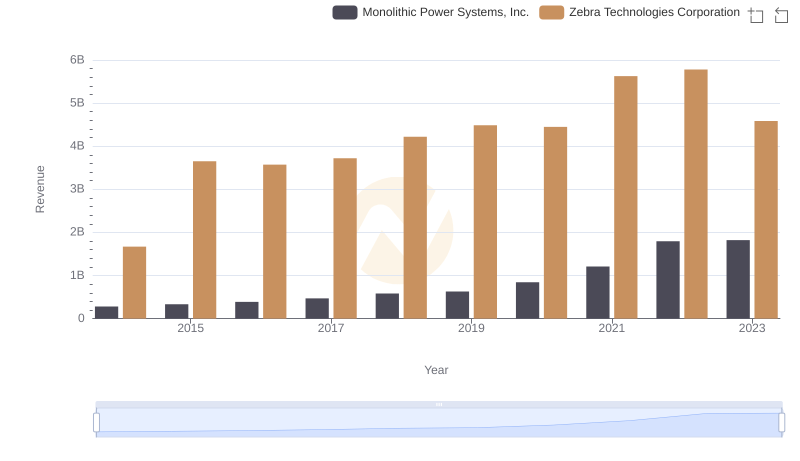
Revenue Showdown: Monolithic Power Systems, Inc. vs Zebra Technologies Corporation
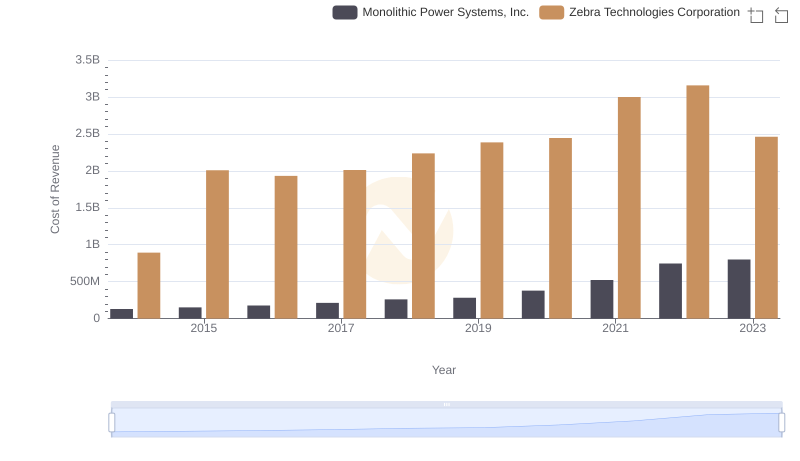
Monolithic Power Systems, Inc. vs Zebra Technologies Corporation: Efficiency in Cost of Revenue Explored
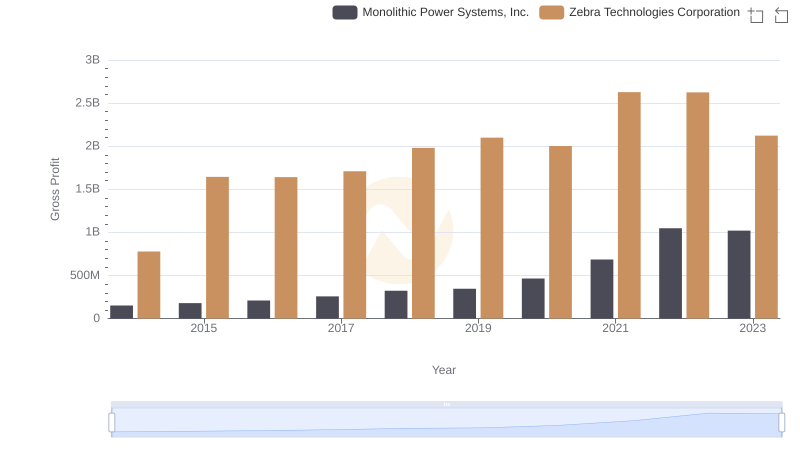
Monolithic Power Systems, Inc. vs Zebra Technologies Corporation: A Gross Profit Performance Breakdown

Research and Development: Comparing Key Metrics for Monolithic Power Systems, Inc. and Zebra Technologies Corporation
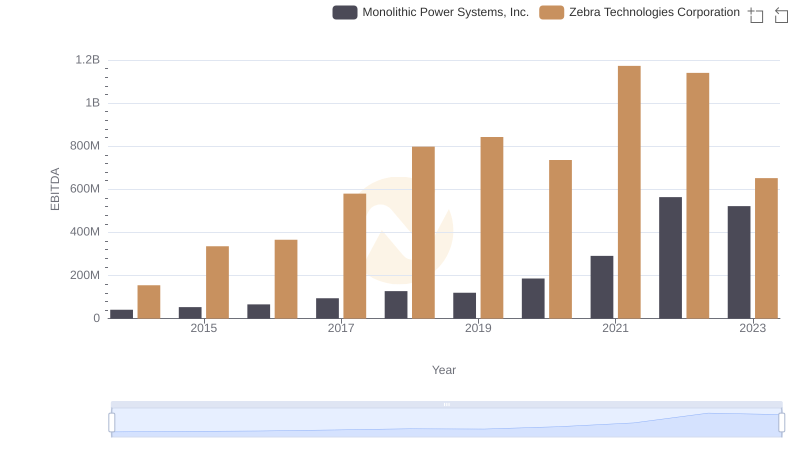
A Professional Review of EBITDA: Monolithic Power Systems, Inc. Compared to Zebra Technologies Corporation