| __timestamp | Monolithic Power Systems, Inc. | Zebra Technologies Corporation |
|---|---|---|
| Wednesday, January 1, 2014 | 41003000 | 154836000 |
| Thursday, January 1, 2015 | 53346000 | 336000000 |
| Friday, January 1, 2016 | 65992000 | 366000000 |
| Sunday, January 1, 2017 | 94768000 | 580000000 |
| Monday, January 1, 2018 | 127721000 | 798000000 |
| Tuesday, January 1, 2019 | 119893000 | 843000000 |
| Wednesday, January 1, 2020 | 185872000 | 736000000 |
| Friday, January 1, 2021 | 291116000 | 1173000000 |
| Saturday, January 1, 2022 | 563899000 | 1140000000 |
| Sunday, January 1, 2023 | 521904000 | 652000000 |
| Monday, January 1, 2024 | 937000000 |
Unlocking the unknown
In the ever-evolving landscape of technology, Monolithic Power Systems, Inc. and Zebra Technologies Corporation have demonstrated remarkable EBITDA growth over the past decade. From 2014 to 2023, Monolithic Power Systems saw an impressive increase of over 1,200%, starting from a modest $41 million to a robust $522 million. Meanwhile, Zebra Technologies showcased a steady climb, peaking at $1.17 billion in 2021, a 658% rise from its 2014 figures.
These trends highlight the dynamic nature of the tech industry, where strategic innovation and market adaptation are key to sustained financial success.

EBITDA Performance Review: Apple Inc. vs Monolithic Power Systems, Inc.
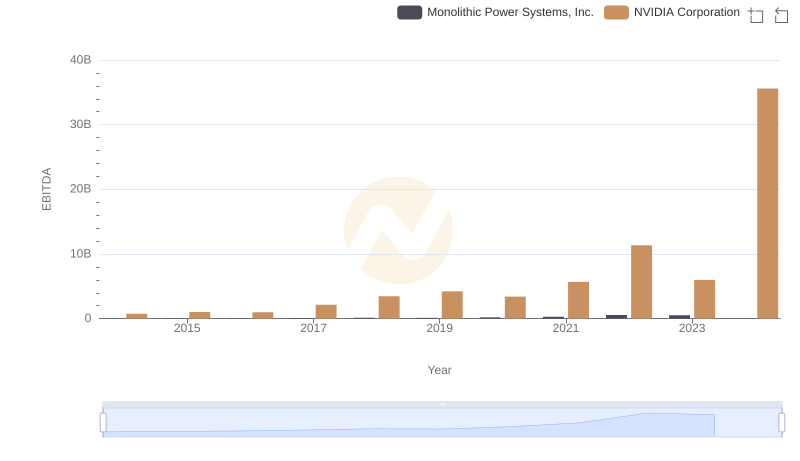
Professional EBITDA Benchmarking: NVIDIA Corporation vs Monolithic Power Systems, Inc.
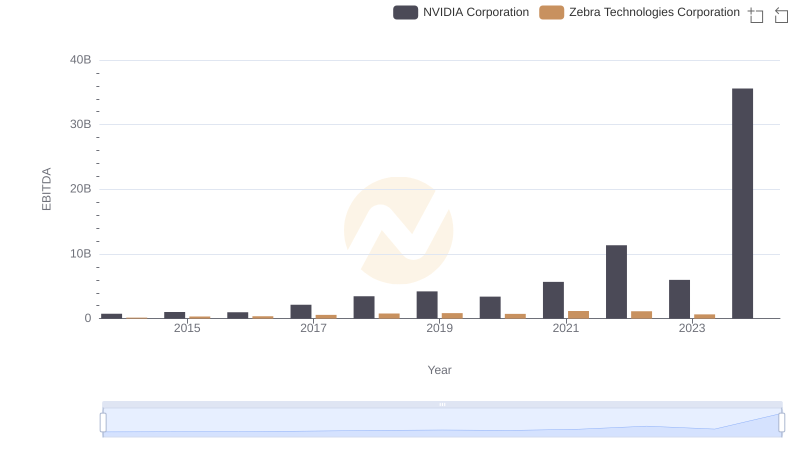
A Side-by-Side Analysis of EBITDA: NVIDIA Corporation and Zebra Technologies Corporation
EBITDA Analysis: Evaluating Taiwan Semiconductor Manufacturing Company Limited Against Monolithic Power Systems, Inc.
EBITDA Performance Review: Taiwan Semiconductor Manufacturing Company Limited vs Zebra Technologies Corporation
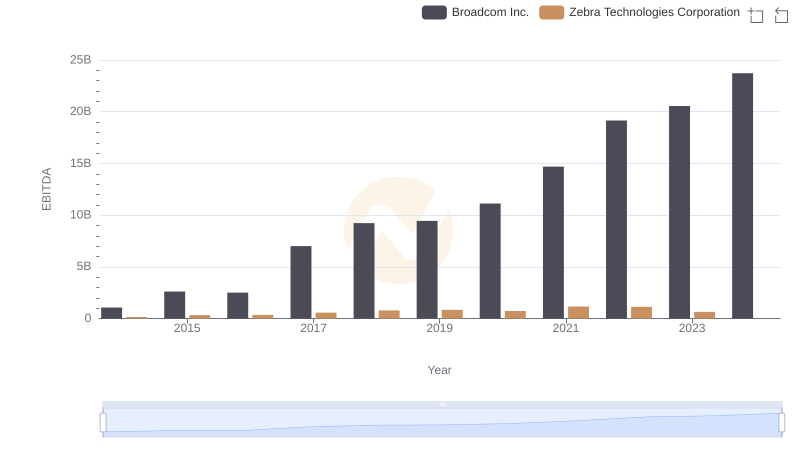
EBITDA Performance Review: Broadcom Inc. vs Zebra Technologies Corporation
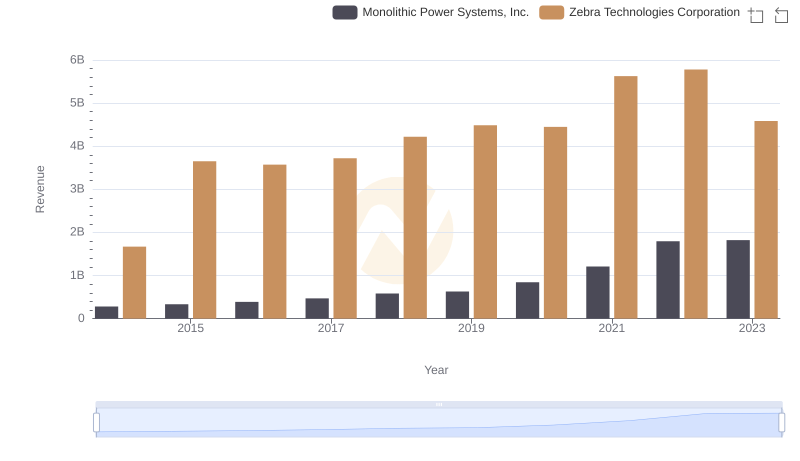
Revenue Showdown: Monolithic Power Systems, Inc. vs Zebra Technologies Corporation
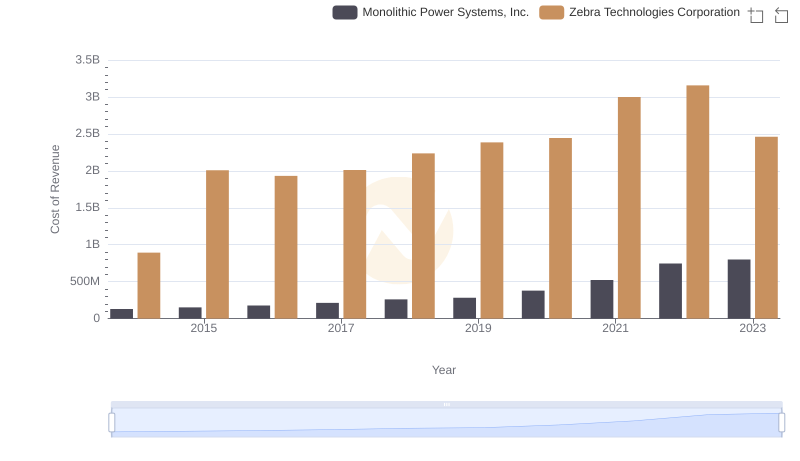
Monolithic Power Systems, Inc. vs Zebra Technologies Corporation: Efficiency in Cost of Revenue Explored
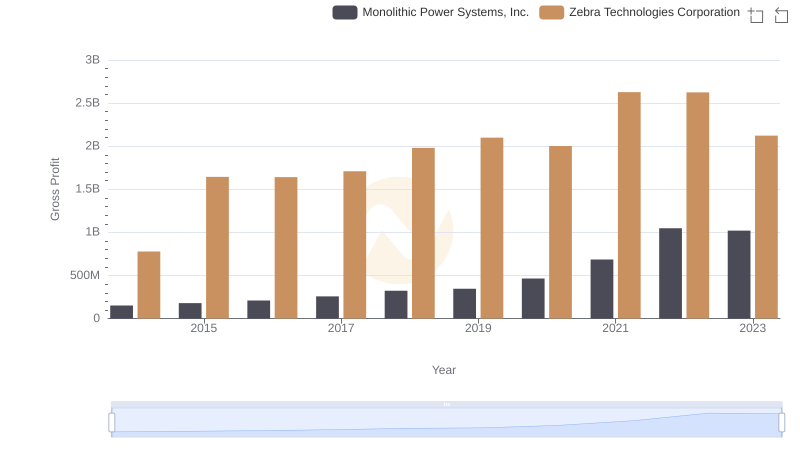
Monolithic Power Systems, Inc. vs Zebra Technologies Corporation: A Gross Profit Performance Breakdown

Research and Development: Comparing Key Metrics for Monolithic Power Systems, Inc. and Zebra Technologies Corporation
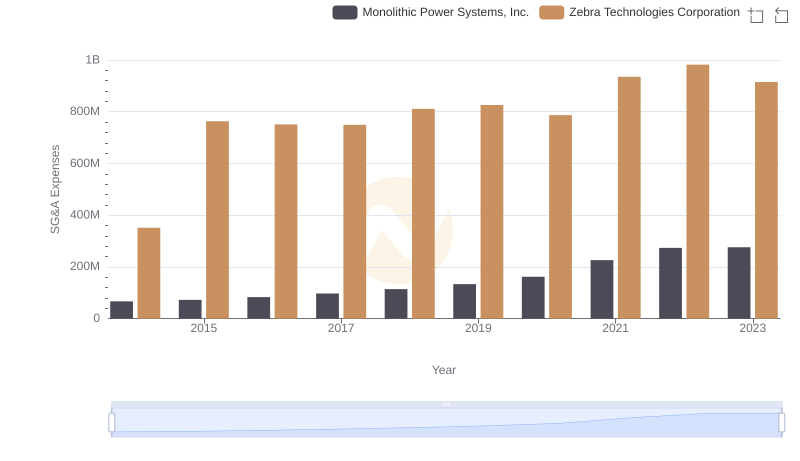
Monolithic Power Systems, Inc. vs Zebra Technologies Corporation: SG&A Expense Trends