| __timestamp | Deere & Company | Hubbell Incorporated |
|---|---|---|
| Wednesday, January 1, 2014 | 10466900000 | 1109000000 |
| Thursday, January 1, 2015 | 8013100000 | 1091800000 |
| Friday, January 1, 2016 | 7649600000 | 1100700000 |
| Sunday, January 1, 2017 | 8683100000 | 1151900000 |
| Monday, January 1, 2018 | 10886100000 | 1300400000 |
| Tuesday, January 1, 2019 | 11587000000 | 1352700000 |
| Wednesday, January 1, 2020 | 11045000000 | 1209300000 |
| Friday, January 1, 2021 | 13917000000 | 1151500000 |
| Saturday, January 1, 2022 | 17239000000 | 1471600000 |
| Sunday, January 1, 2023 | 21117000000 | 1888100000 |
| Monday, January 1, 2024 | 13984000000 | 1904100000 |
Infusing magic into the data realm
In the ever-evolving landscape of industrial giants, Deere & Company and Hubbell Incorporated have showcased intriguing financial trajectories over the past decade. Deere & Company, a stalwart in agricultural machinery, has seen its gross profit soar by approximately 102% from 2014 to 2023, peaking at an impressive $21 billion in 2023. This growth underscores Deere's robust market position and strategic innovations.
Conversely, Hubbell Incorporated, a leader in electrical and utility solutions, experienced a more modest yet steady increase of around 70% in gross profit over the same period, reaching nearly $1.9 billion in 2023. This reflects Hubbell's consistent performance in a competitive sector.
While Deere's 2024 data remains incomplete, the trends highlight the resilience and adaptability of these companies in navigating economic challenges and capitalizing on market opportunities.
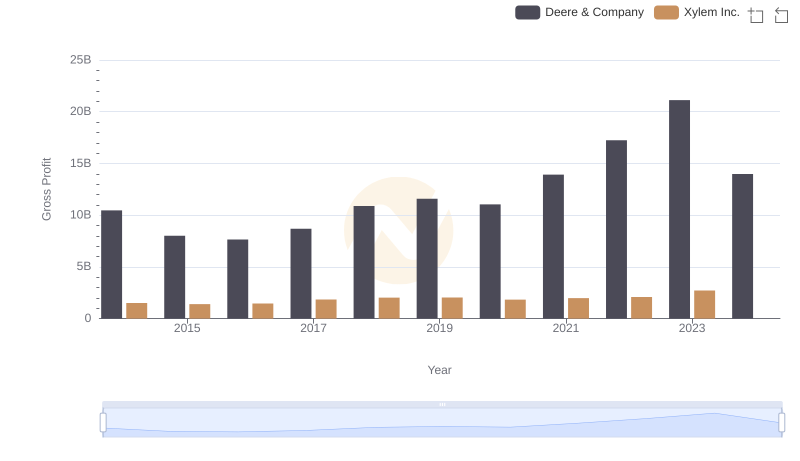
Gross Profit Trends Compared: Deere & Company vs Xylem Inc.
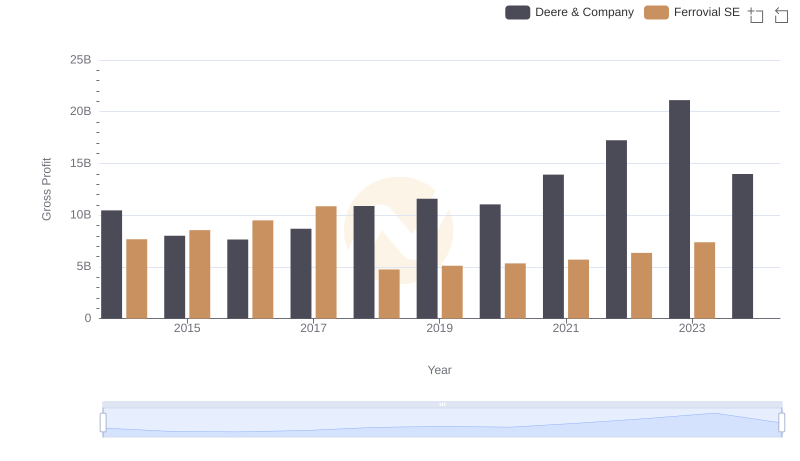
Deere & Company vs Ferrovial SE: A Gross Profit Performance Breakdown

Annual Revenue Comparison: Deere & Company vs Hubbell Incorporated
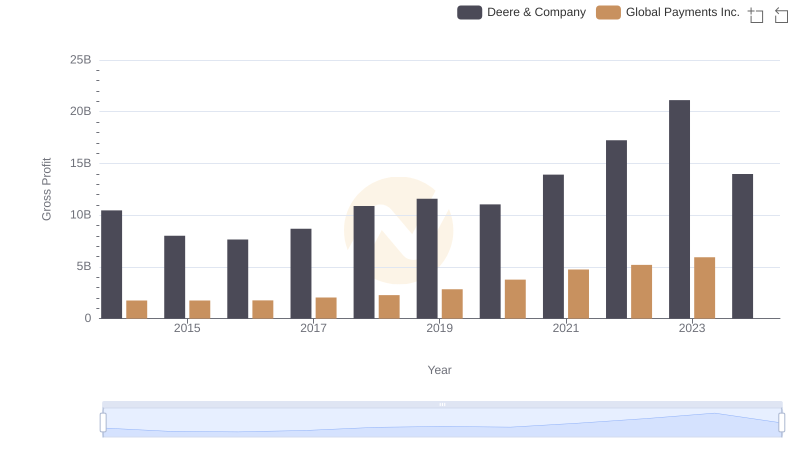
Who Generates Higher Gross Profit? Deere & Company or Global Payments Inc.
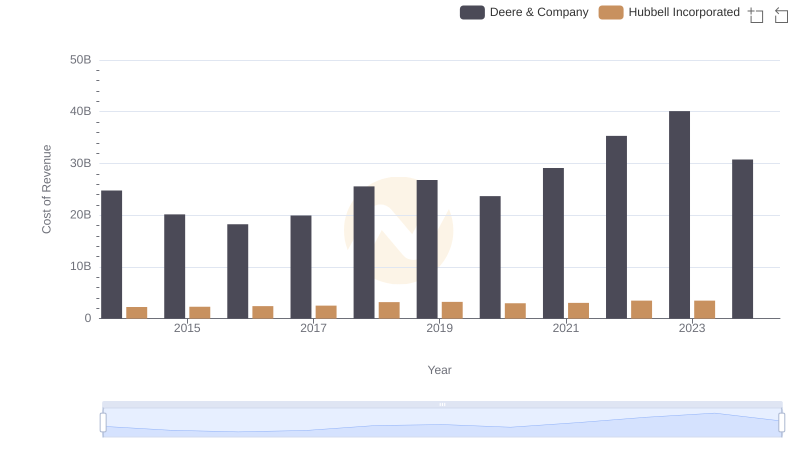
Comparing Cost of Revenue Efficiency: Deere & Company vs Hubbell Incorporated
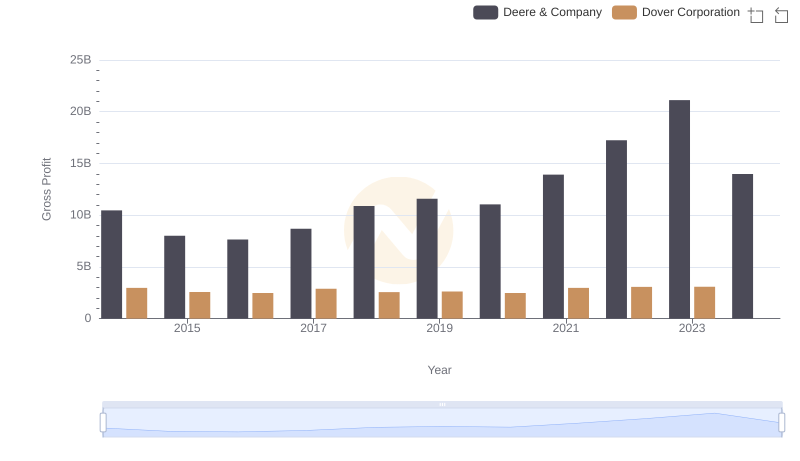
Key Insights on Gross Profit: Deere & Company vs Dover Corporation

Deere & Company and Builders FirstSource, Inc.: A Detailed Gross Profit Analysis
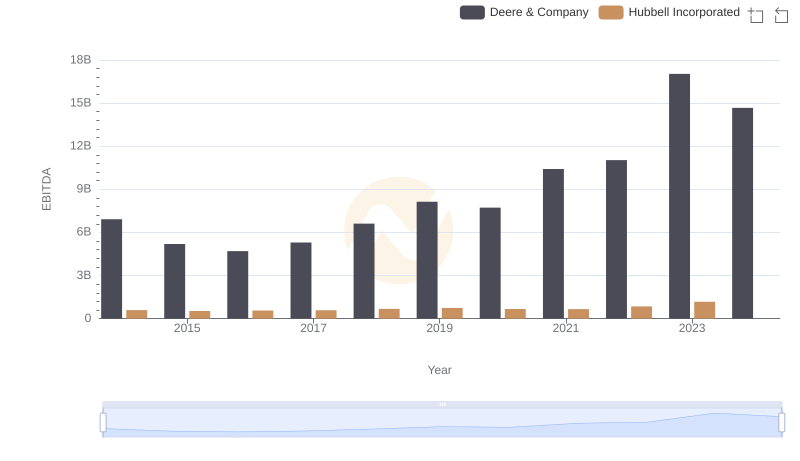
EBITDA Analysis: Evaluating Deere & Company Against Hubbell Incorporated