| __timestamp | Builders FirstSource, Inc. | Deere & Company |
|---|---|---|
| Wednesday, January 1, 2014 | 356997000 | 10466900000 |
| Thursday, January 1, 2015 | 901458000 | 8013100000 |
| Friday, January 1, 2016 | 1596748000 | 7649600000 |
| Sunday, January 1, 2017 | 1727391000 | 8683100000 |
| Monday, January 1, 2018 | 1922940000 | 10886100000 |
| Tuesday, January 1, 2019 | 1976829000 | 11587000000 |
| Wednesday, January 1, 2020 | 2222584000 | 11045000000 |
| Friday, January 1, 2021 | 5850956000 | 13917000000 |
| Saturday, January 1, 2022 | 7744379000 | 17239000000 |
| Sunday, January 1, 2023 | 6012334000 | 21117000000 |
| Monday, January 1, 2024 | 13984000000 |
Cracking the code
In the ever-evolving landscape of the construction and agricultural machinery sectors, understanding the financial health of industry leaders is crucial. Over the past decade, Deere & Company and Builders FirstSource, Inc. have showcased distinct trajectories in their gross profit margins. From 2014 to 2023, Deere & Company consistently outperformed, with gross profits peaking at approximately $21 billion in 2023, marking a 100% increase from 2016. In contrast, Builders FirstSource, Inc. experienced a remarkable surge, with gross profits growing over 1,500% from 2014 to 2022, before a slight dip in 2023. This data highlights the resilience and adaptability of these companies amidst market fluctuations. Notably, the absence of data for Builders FirstSource, Inc. in 2024 suggests potential reporting delays or strategic shifts. As these giants continue to navigate economic challenges, stakeholders must stay informed to make strategic decisions.
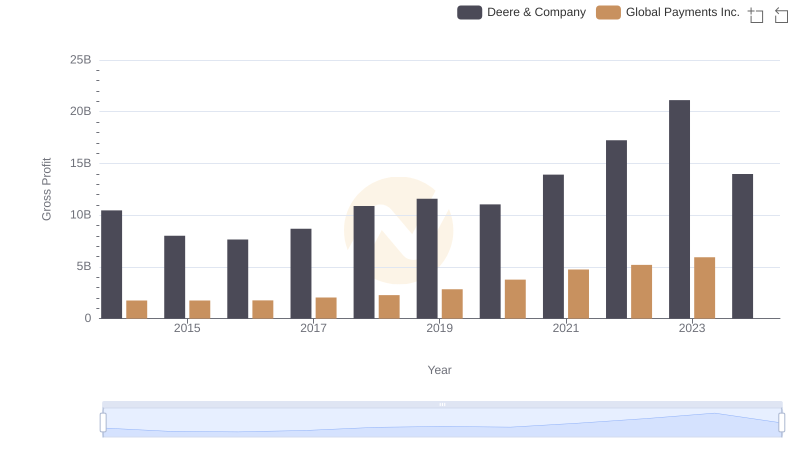
Who Generates Higher Gross Profit? Deere & Company or Global Payments Inc.
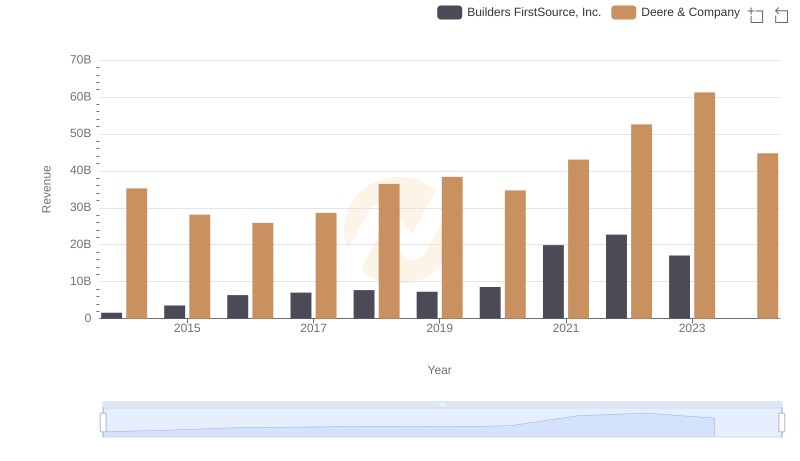
Who Generates More Revenue? Deere & Company or Builders FirstSource, Inc.

Comparing Cost of Revenue Efficiency: Deere & Company vs Builders FirstSource, Inc.

Key Insights on Gross Profit: Deere & Company vs Dover Corporation
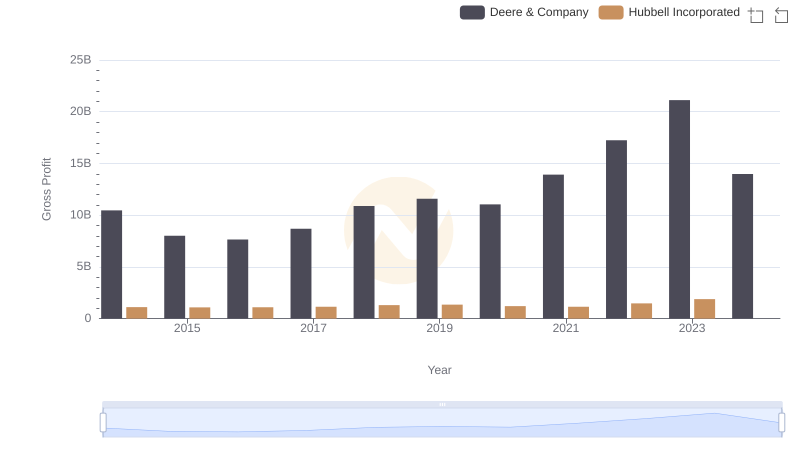
Key Insights on Gross Profit: Deere & Company vs Hubbell Incorporated
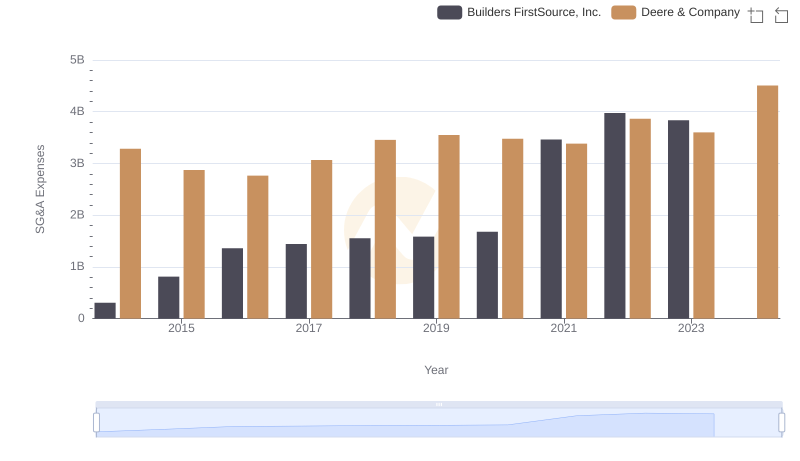
Deere & Company vs Builders FirstSource, Inc.: SG&A Expense Trends