| __timestamp | Marvell Technology, Inc. | Tyler Technologies, Inc. |
|---|---|---|
| Wednesday, January 1, 2014 | 1750170000 | 233371000 |
| Thursday, January 1, 2015 | 1863257000 | 277187000 |
| Friday, January 1, 2016 | 1231092000 | 355351000 |
| Sunday, January 1, 2017 | 1288147000 | 399140000 |
| Monday, January 1, 2018 | 1461940000 | 439578000 |
| Tuesday, January 1, 2019 | 1458392000 | 516900000 |
| Wednesday, January 1, 2020 | 1356941000 | 542512000 |
| Friday, January 1, 2021 | 1488350000 | 709644000 |
| Saturday, January 1, 2022 | 2064225000 | 783863000 |
| Sunday, January 1, 2023 | 2987500000 | 861099000 |
| Monday, January 1, 2024 | 2293600000 | 935761000 |
Unleashing insights
In the ever-evolving landscape of technology, Marvell Technology, Inc. and Tyler Technologies, Inc. have carved distinct paths. Over the past decade, Marvell's gross profit has surged by approximately 71%, peaking in 2023. This growth reflects its strategic innovations and market adaptability. In contrast, Tyler Technologies has shown a steady upward trajectory, with a 269% increase in gross profit from 2014 to 2023, underscoring its robust expansion in public sector software solutions.
While Marvell's profits soared to new heights in 2023, Tyler's consistent growth highlights its resilience and focus on sustainable development. The data from 2024 remains incomplete, leaving room for speculation on future trends. As these companies continue to innovate, their financial journeys offer valuable insights into the dynamic tech industry.
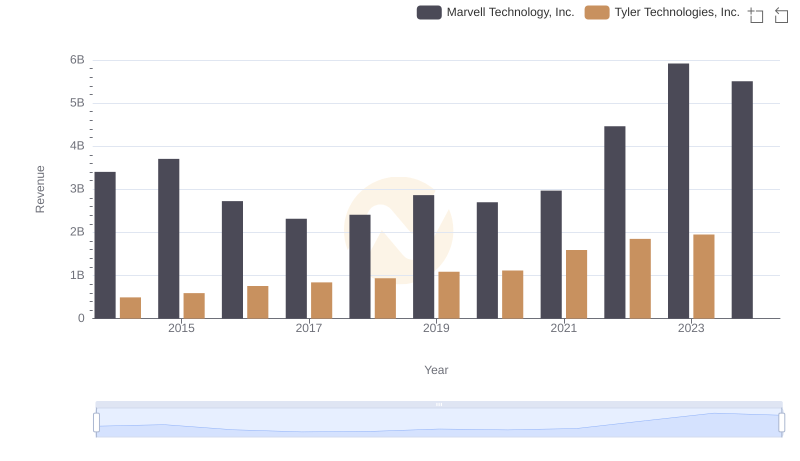
Breaking Down Revenue Trends: Marvell Technology, Inc. vs Tyler Technologies, Inc.

Marvell Technology, Inc. and GoDaddy Inc.: A Detailed Gross Profit Analysis
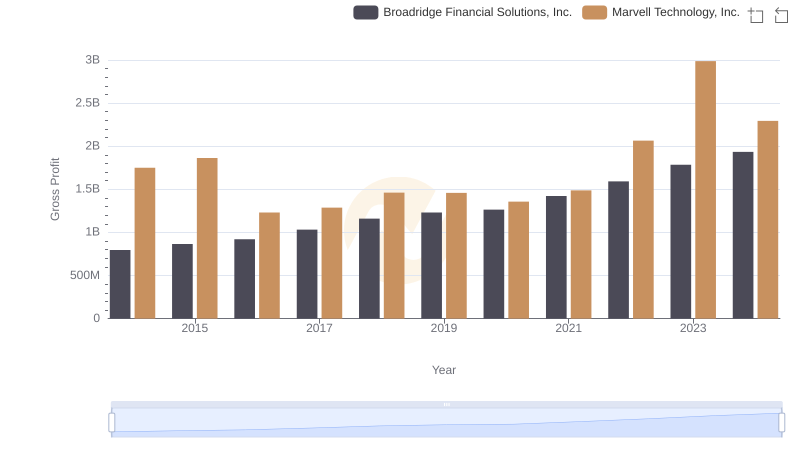
Gross Profit Comparison: Marvell Technology, Inc. and Broadridge Financial Solutions, Inc. Trends
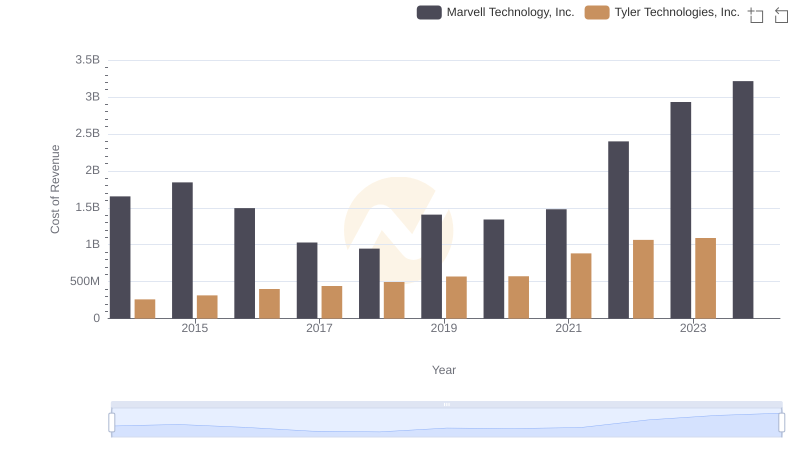
Cost of Revenue Trends: Marvell Technology, Inc. vs Tyler Technologies, Inc.
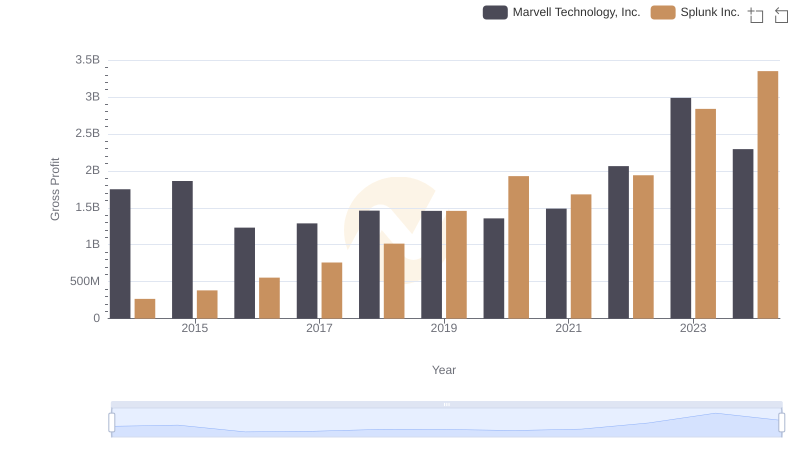
Key Insights on Gross Profit: Marvell Technology, Inc. vs Splunk Inc.
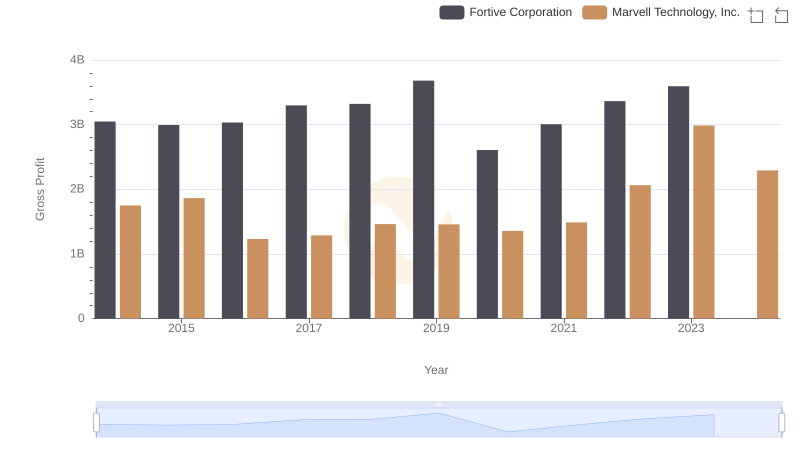
Marvell Technology, Inc. and Fortive Corporation: A Detailed Gross Profit Analysis
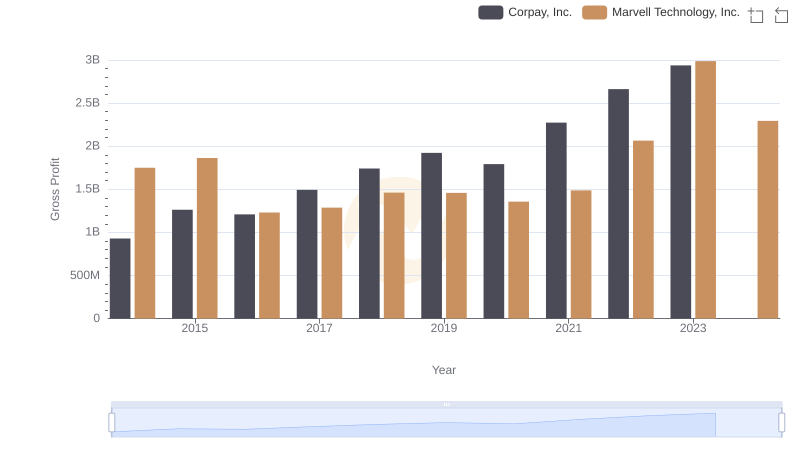
Gross Profit Comparison: Marvell Technology, Inc. and Corpay, Inc. Trends
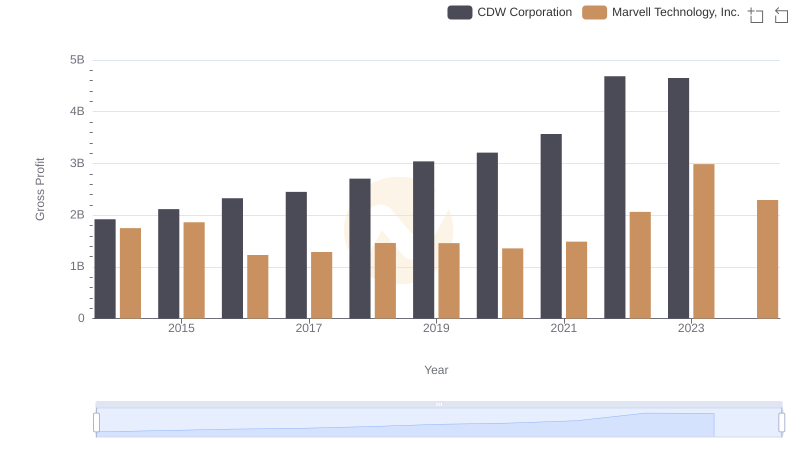
Gross Profit Comparison: Marvell Technology, Inc. and CDW Corporation Trends
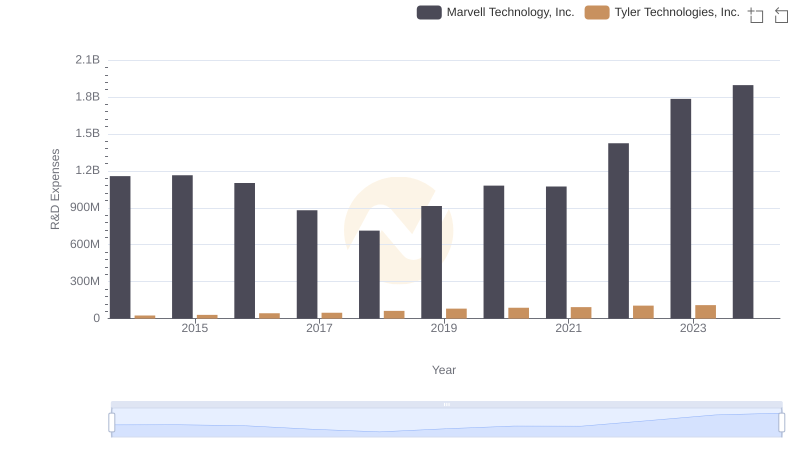
Research and Development Investment: Marvell Technology, Inc. vs Tyler Technologies, Inc.
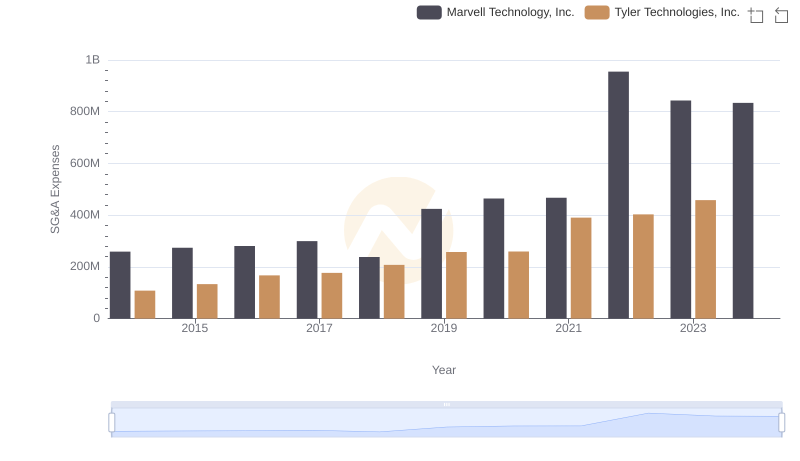
Who Optimizes SG&A Costs Better? Marvell Technology, Inc. or Tyler Technologies, Inc.
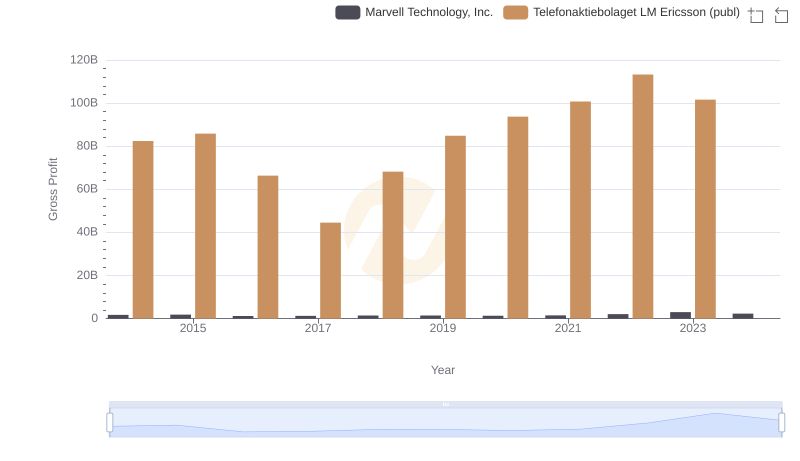
Gross Profit Trends Compared: Marvell Technology, Inc. vs Telefonaktiebolaget LM Ericsson (publ)
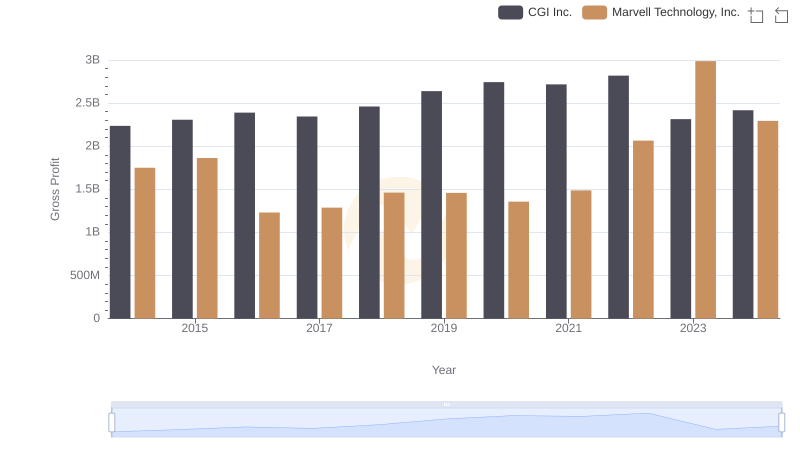
Gross Profit Trends Compared: Marvell Technology, Inc. vs CGI Inc.