| __timestamp | Marvell Technology, Inc. | Tyler Technologies, Inc. |
|---|---|---|
| Wednesday, January 1, 2014 | 3404400000 | 493101000 |
| Thursday, January 1, 2015 | 3706963000 | 591022000 |
| Friday, January 1, 2016 | 2725828000 | 756043000 |
| Sunday, January 1, 2017 | 2317674000 | 840662000 |
| Monday, January 1, 2018 | 2409170000 | 935282000 |
| Tuesday, January 1, 2019 | 2865791000 | 1086427000 |
| Wednesday, January 1, 2020 | 2699161000 | 1116663000 |
| Friday, January 1, 2021 | 2968900000 | 1592287000 |
| Saturday, January 1, 2022 | 4462383000 | 1850204000 |
| Sunday, January 1, 2023 | 5919600000 | 1951751000 |
| Monday, January 1, 2024 | 5507700000 | 2137803000 |
Unlocking the unknown
In the ever-evolving tech landscape, Marvell Technology, Inc. and Tyler Technologies, Inc. have showcased intriguing revenue trajectories over the past decade. From 2014 to 2023, Marvell Technology's revenue surged by approximately 74%, peaking in 2023. This growth reflects its strategic innovations and market adaptability. In contrast, Tyler Technologies experienced a steady revenue increase of nearly 300% from 2014 to 2023, underscoring its robust expansion in the public sector software market.
While Marvell's 2024 data remains elusive, the trends suggest a continued competitive edge for both companies in their respective domains.
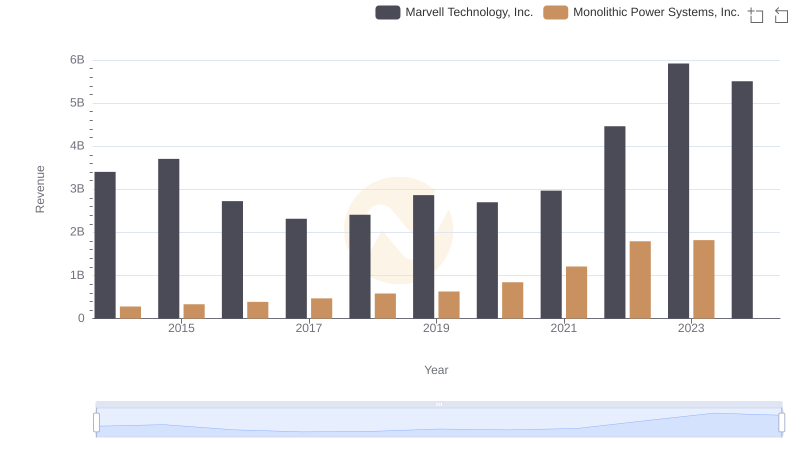
Marvell Technology, Inc. or Monolithic Power Systems, Inc.: Who Leads in Yearly Revenue?
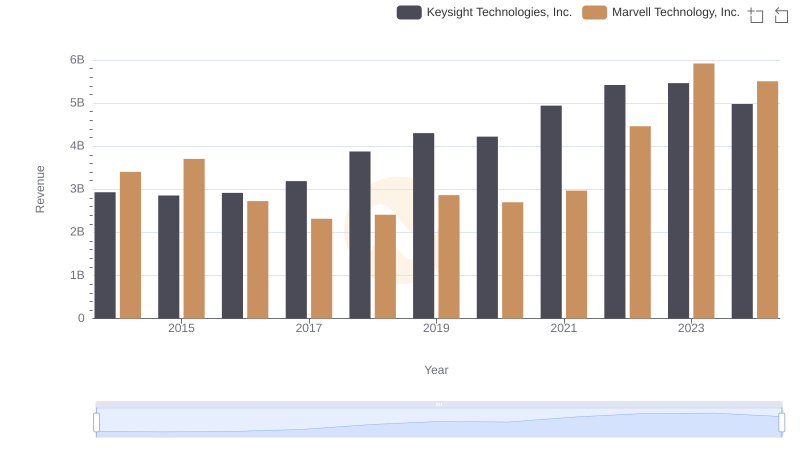
Revenue Showdown: Marvell Technology, Inc. vs Keysight Technologies, Inc.
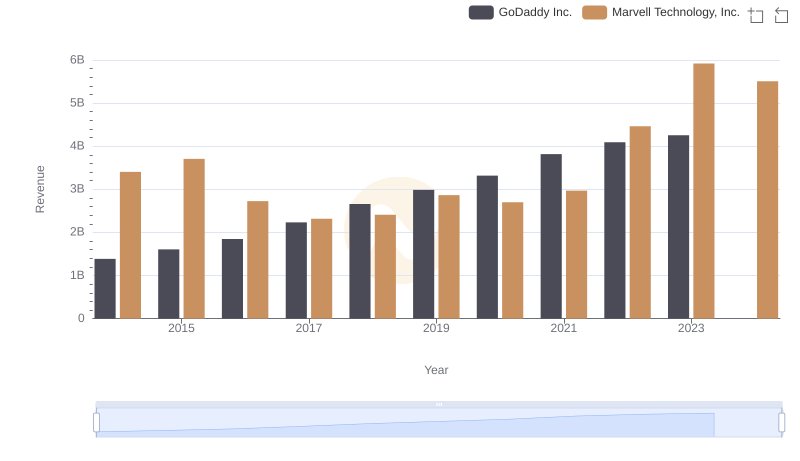
Who Generates More Revenue? Marvell Technology, Inc. or GoDaddy Inc.
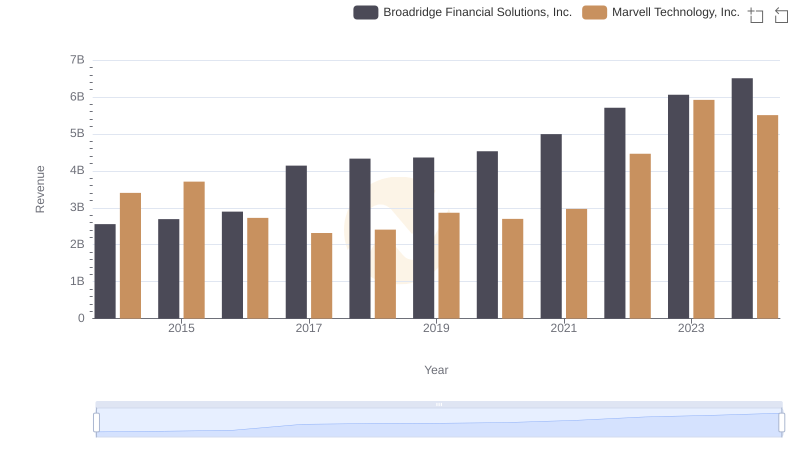
Revenue Insights: Marvell Technology, Inc. and Broadridge Financial Solutions, Inc. Performance Compared
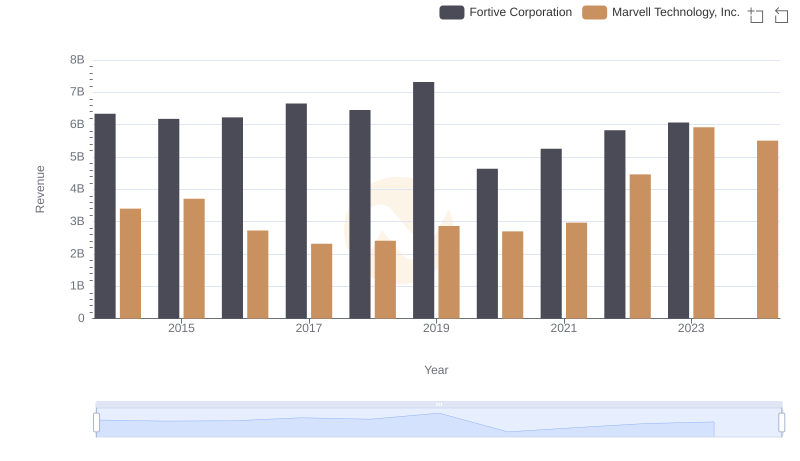
Revenue Showdown: Marvell Technology, Inc. vs Fortive Corporation
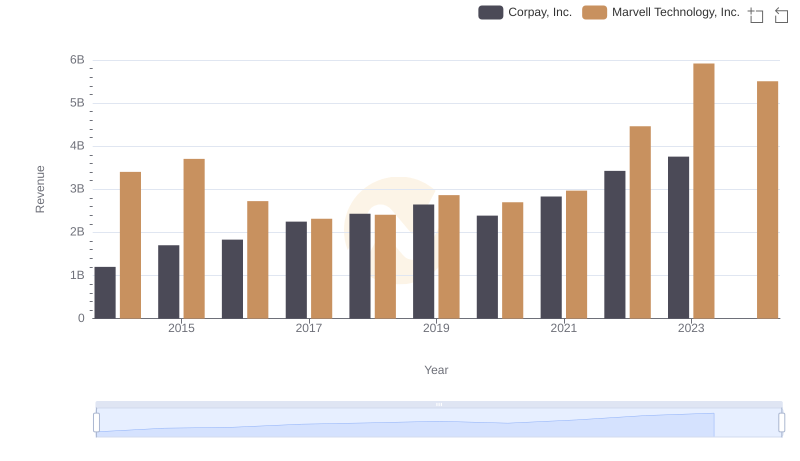
Revenue Showdown: Marvell Technology, Inc. vs Corpay, Inc.
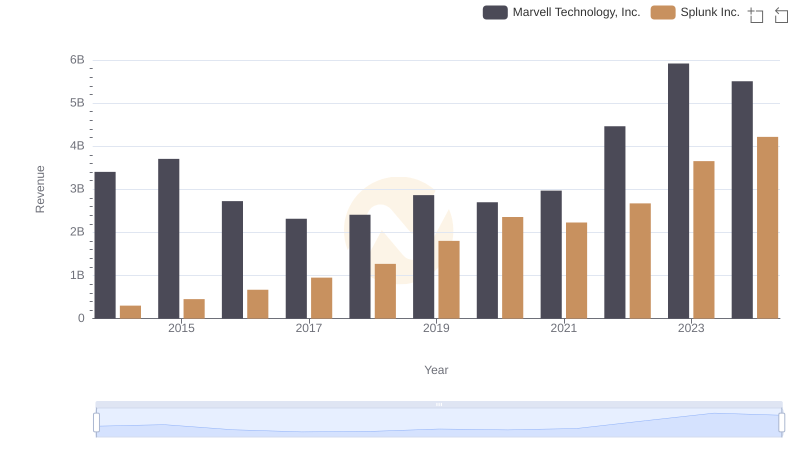
Marvell Technology, Inc. vs Splunk Inc.: Examining Key Revenue Metrics
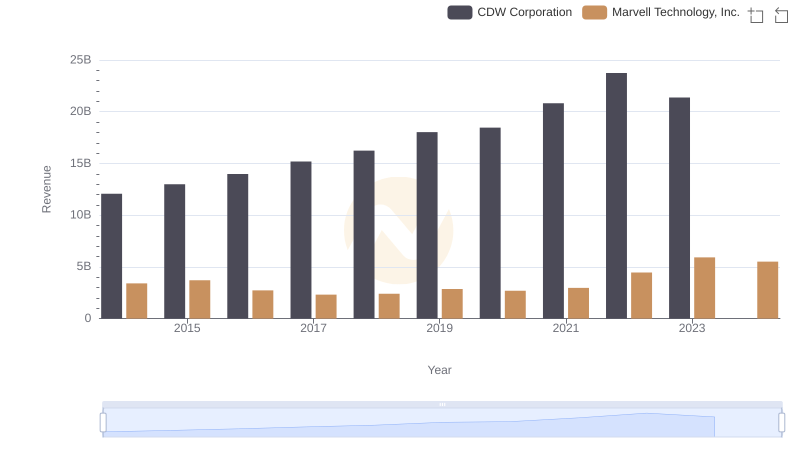
Comparing Revenue Performance: Marvell Technology, Inc. or CDW Corporation?
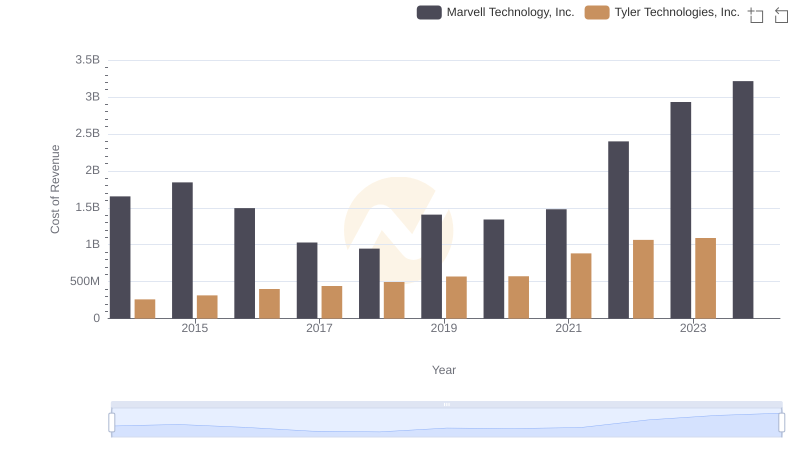
Cost of Revenue Trends: Marvell Technology, Inc. vs Tyler Technologies, Inc.
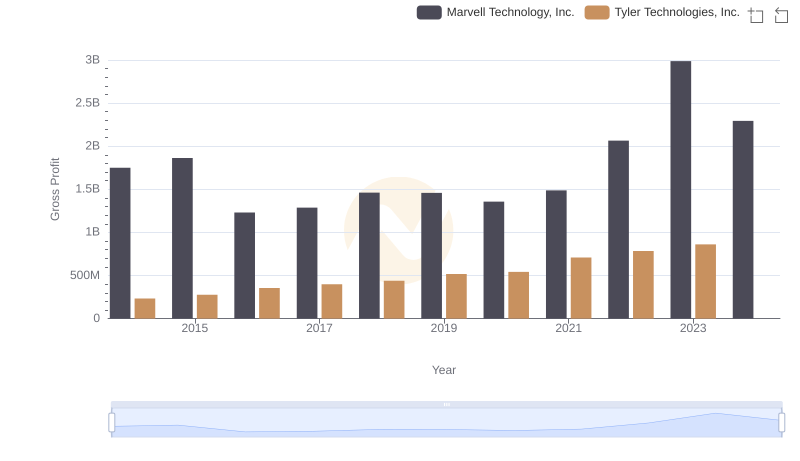
Gross Profit Comparison: Marvell Technology, Inc. and Tyler Technologies, Inc. Trends
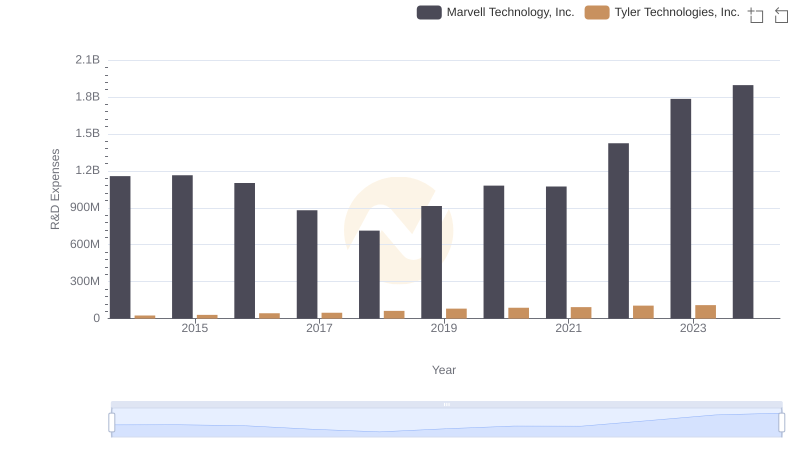
Research and Development Investment: Marvell Technology, Inc. vs Tyler Technologies, Inc.
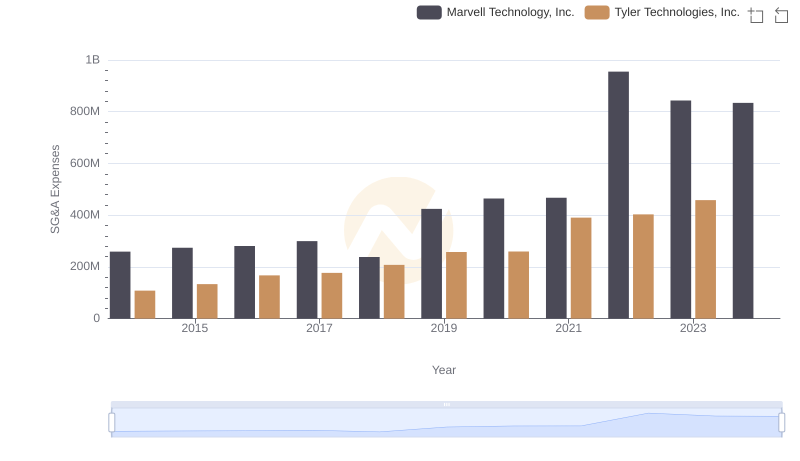
Who Optimizes SG&A Costs Better? Marvell Technology, Inc. or Tyler Technologies, Inc.