| __timestamp | Accenture plc | Fiserv, Inc. |
|---|---|---|
| Wednesday, January 1, 2014 | 9684466000 | 2185000000 |
| Thursday, January 1, 2015 | 9809239000 | 2345000000 |
| Friday, January 1, 2016 | 10277427000 | 2546000000 |
| Sunday, January 1, 2017 | 11030492000 | 2672000000 |
| Monday, January 1, 2018 | 12442913000 | 2754000000 |
| Tuesday, January 1, 2019 | 13314688000 | 4878000000 |
| Wednesday, January 1, 2020 | 13976158000 | 7040000000 |
| Friday, January 1, 2021 | 16364128000 | 8098000000 |
| Saturday, January 1, 2022 | 19701539000 | 9745000000 |
| Sunday, January 1, 2023 | 20731607000 | 11423000000 |
| Monday, January 1, 2024 | 21162317000 | 20456000000 |
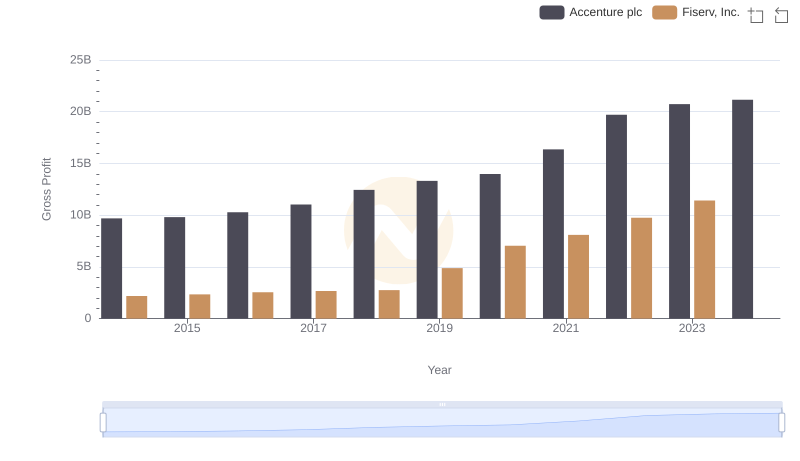
Unleashing insights
Over the past decade, Accenture plc and Fiserv, Inc. have showcased remarkable growth in their gross profits, reflecting their strategic prowess in the global market. From 2014 to 2023, Accenture's gross profit surged by approximately 118%, highlighting its robust business model and adaptability in a rapidly changing industry. In contrast, Fiserv experienced a significant 423% increase, underscoring its aggressive expansion and innovation in financial services.
Accenture consistently outperformed Fiserv in absolute terms, with its gross profit peaking at over $21 billion in 2023. However, Fiserv's growth trajectory is noteworthy, especially from 2019 onwards, where it nearly doubled its gross profit by 2023. The data for 2024 remains incomplete, leaving room for speculation on future trends. This analysis provides a compelling narrative of how these industry giants have navigated economic challenges and opportunities over the years.
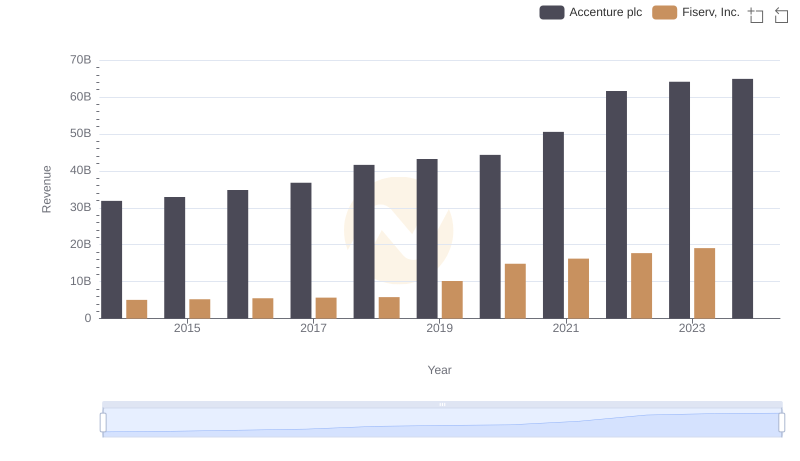
Revenue Showdown: Accenture plc vs Fiserv, Inc.

Revenue Insights: Accenture plc and Fiserv, Inc. Performance Compared

Cost of Revenue: Key Insights for Accenture plc and Fiserv, Inc.
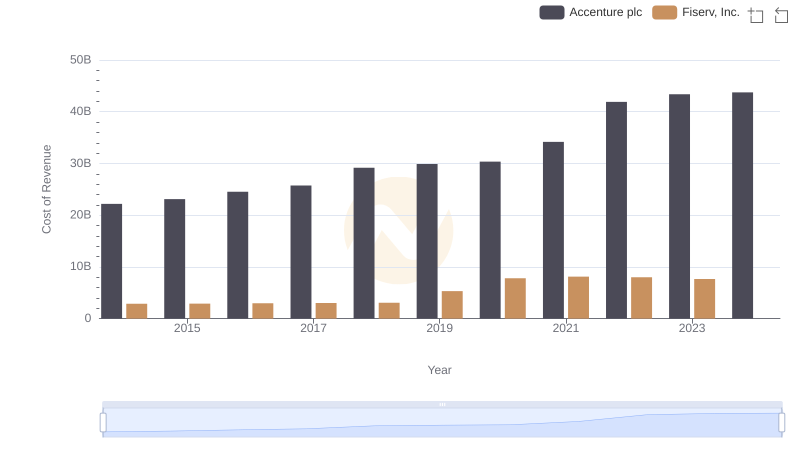
Cost of Revenue Comparison: Accenture plc vs Fiserv, Inc.
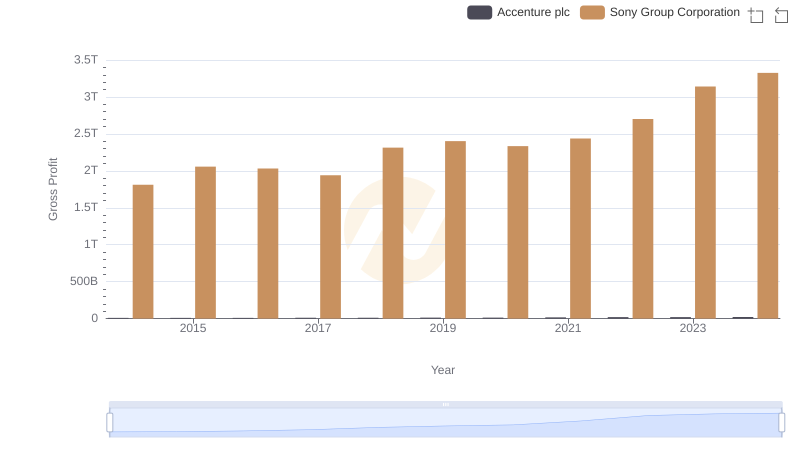
Accenture plc vs Sony Group Corporation: A Gross Profit Performance Breakdown
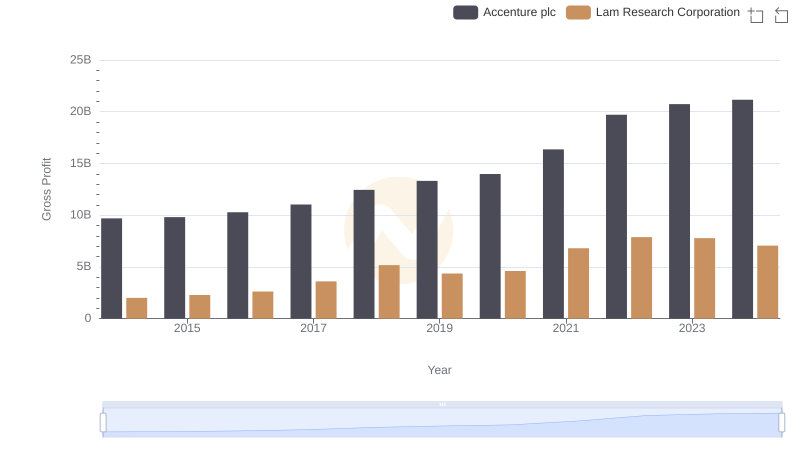
Accenture plc and Lam Research Corporation: A Detailed Gross Profit Analysis
Accenture plc vs Fiserv, Inc.: A Gross Profit Performance Breakdown
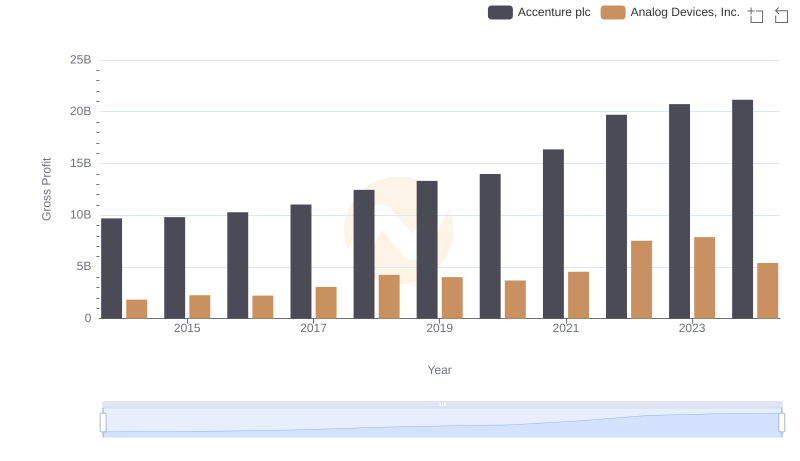
Key Insights on Gross Profit: Accenture plc vs Analog Devices, Inc.
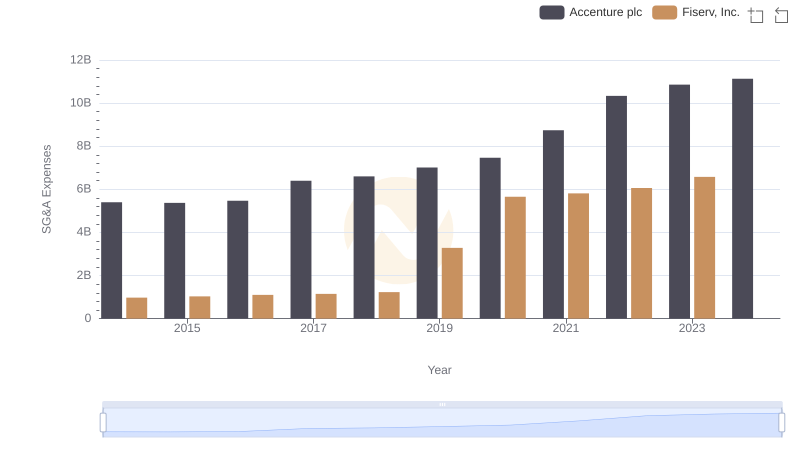
SG&A Efficiency Analysis: Comparing Accenture plc and Fiserv, Inc.

Accenture plc vs Fiserv, Inc.: SG&A Expense Trends

Accenture plc vs Fiserv, Inc.: In-Depth EBITDA Performance Comparison
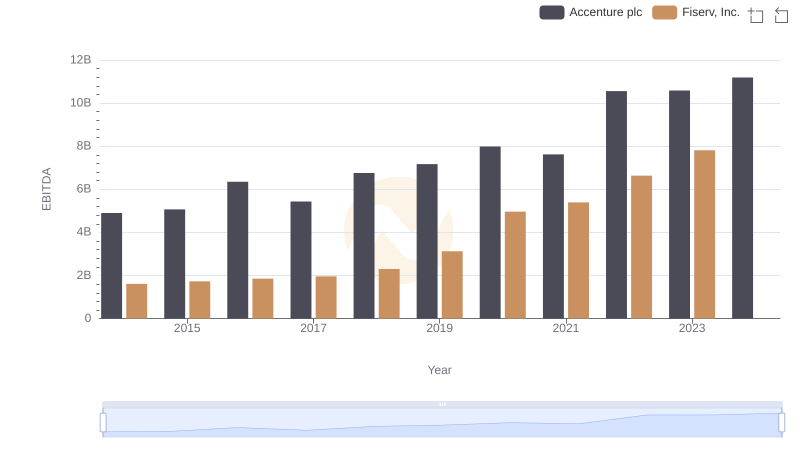
EBITDA Analysis: Evaluating Accenture plc Against Fiserv, Inc.