| __timestamp | Ferrovial SE | United Parcel Service, Inc. |
|---|---|---|
| Wednesday, January 1, 2014 | 983000000 | 9055000000 |
| Thursday, January 1, 2015 | 1027000000 | 9870000000 |
| Friday, January 1, 2016 | 943000000 | 9740000000 |
| Sunday, January 1, 2017 | 515000000 | 9611000000 |
| Monday, January 1, 2018 | 661000000 | 9292000000 |
| Tuesday, January 1, 2019 | 121000000 | 10194000000 |
| Wednesday, January 1, 2020 | 116000000 | 10366000000 |
| Friday, January 1, 2021 | 610000000 | 15821000000 |
| Saturday, January 1, 2022 | 756000000 | 17005000000 |
| Sunday, January 1, 2023 | 1524000000 | 12714000000 |
| Monday, January 1, 2024 | 10185000000 |
Data in motion
In the ever-evolving landscape of global logistics and infrastructure, United Parcel Service, Inc. (UPS) and Ferrovial SE stand as titans in their respective fields. From 2014 to 2023, UPS consistently outperformed Ferrovial SE in terms of EBITDA, showcasing its robust financial health. Notably, UPS's EBITDA surged by approximately 88% from 2014 to 2022, peaking in 2022 with a remarkable 17 billion USD. In contrast, Ferrovial SE experienced a more volatile journey, with its EBITDA fluctuating significantly, culminating in a 55% increase in 2023 compared to 2014. This disparity highlights UPS's strategic resilience and operational efficiency, while Ferrovial SE's performance reflects the challenges and opportunities within the infrastructure sector. As we look to the future, these insights underscore the importance of strategic adaptability in maintaining financial growth.
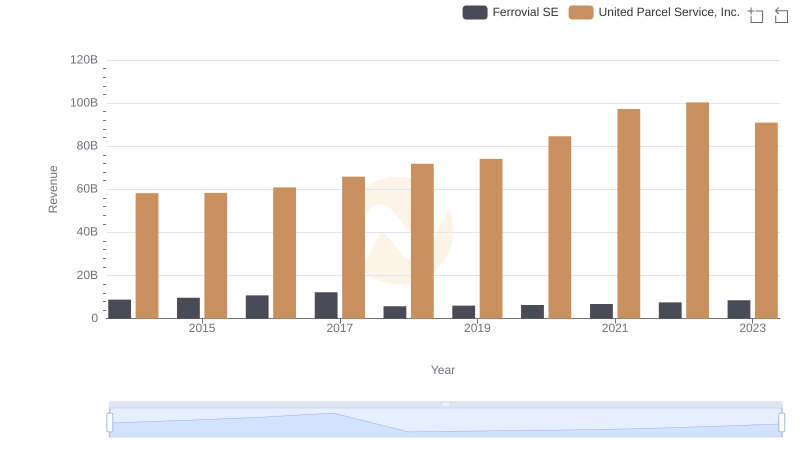
United Parcel Service, Inc. vs Ferrovial SE: Examining Key Revenue Metrics
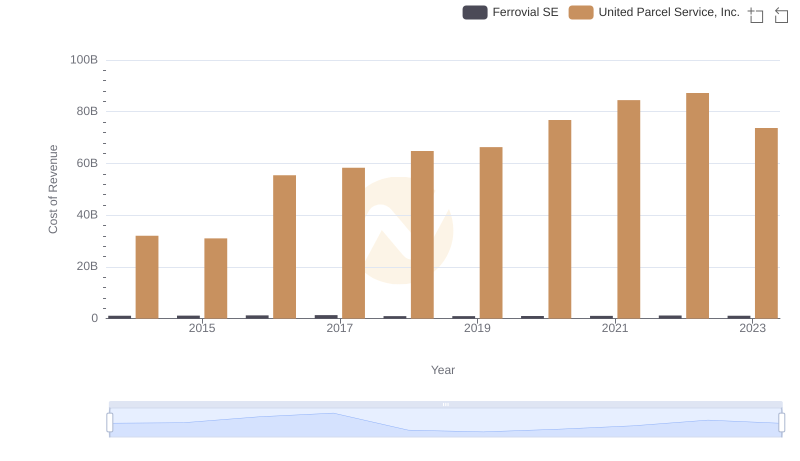
Cost of Revenue: Key Insights for United Parcel Service, Inc. and Ferrovial SE
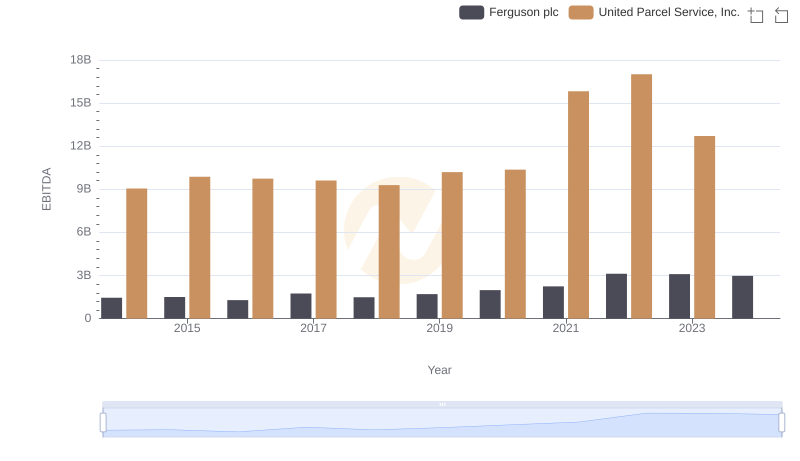
EBITDA Performance Review: United Parcel Service, Inc. vs Ferguson plc
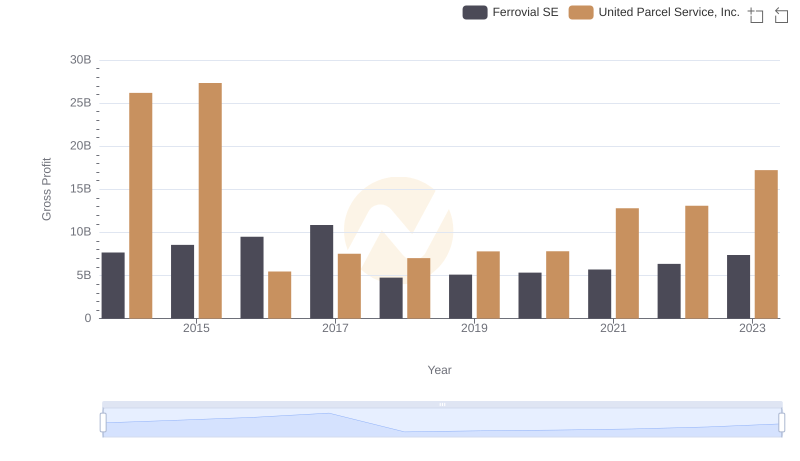
Key Insights on Gross Profit: United Parcel Service, Inc. vs Ferrovial SE
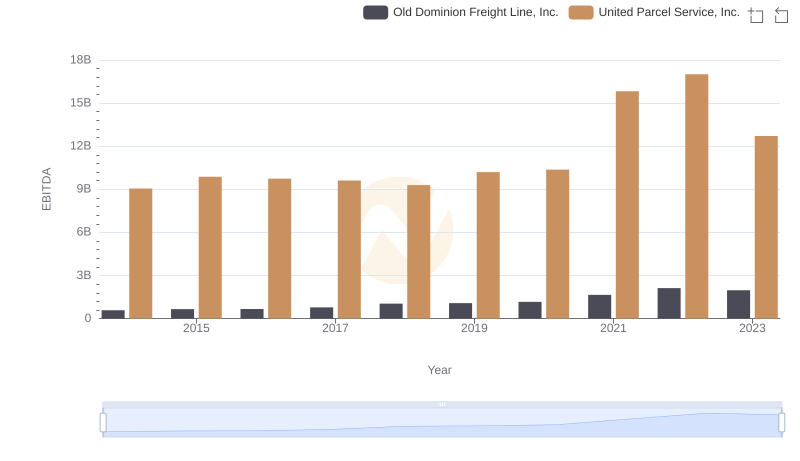
Professional EBITDA Benchmarking: United Parcel Service, Inc. vs Old Dominion Freight Line, Inc.
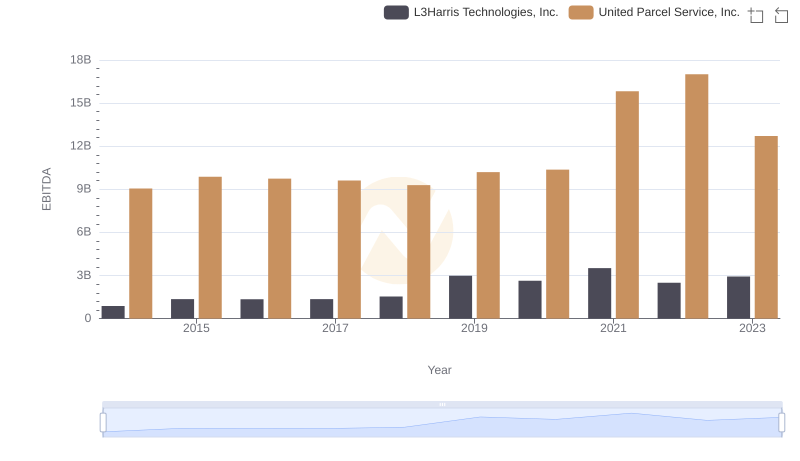
A Side-by-Side Analysis of EBITDA: United Parcel Service, Inc. and L3Harris Technologies, Inc.

United Parcel Service, Inc. and Westinghouse Air Brake Technologies Corporation: A Detailed Examination of EBITDA Performance
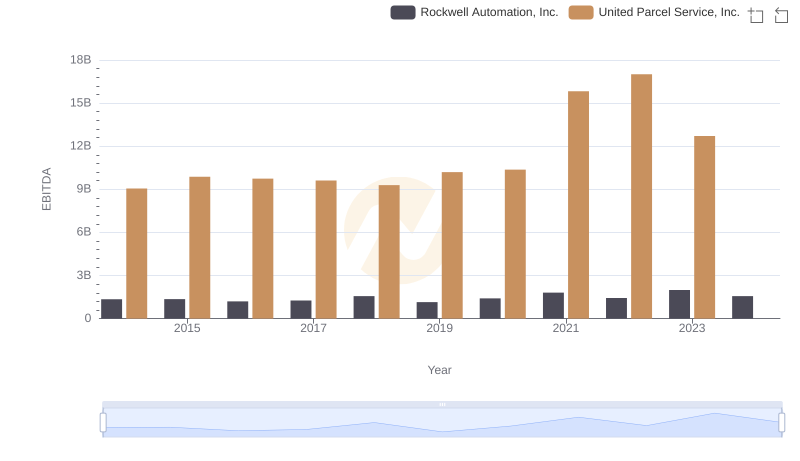
Professional EBITDA Benchmarking: United Parcel Service, Inc. vs Rockwell Automation, Inc.
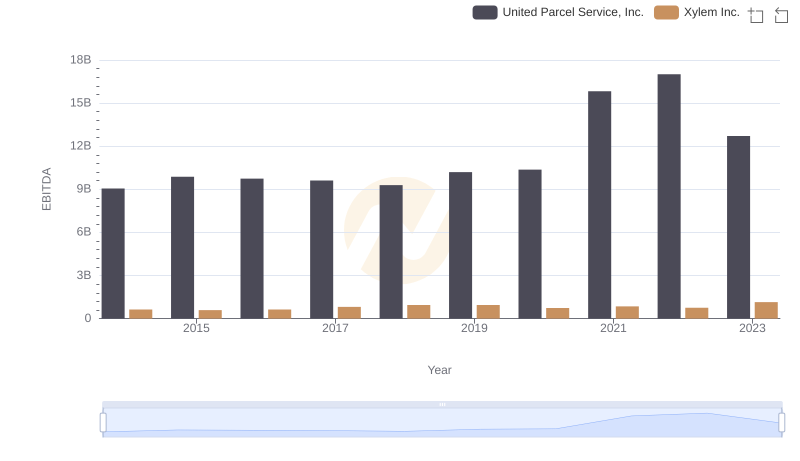
Comprehensive EBITDA Comparison: United Parcel Service, Inc. vs Xylem Inc.
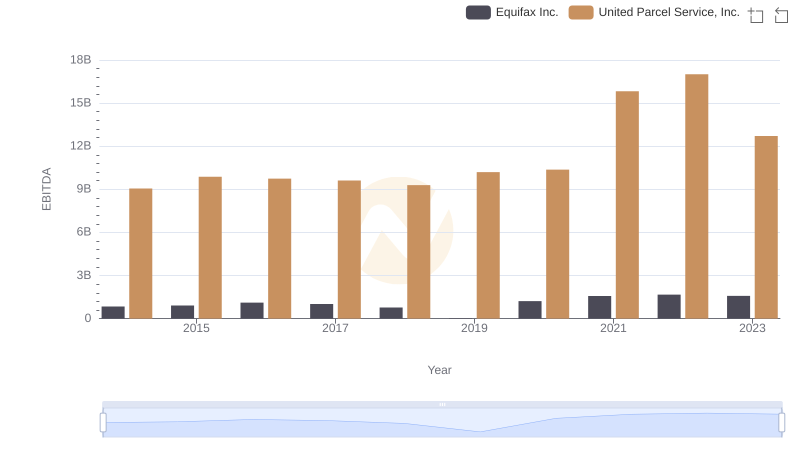
EBITDA Performance Review: United Parcel Service, Inc. vs Equifax Inc.
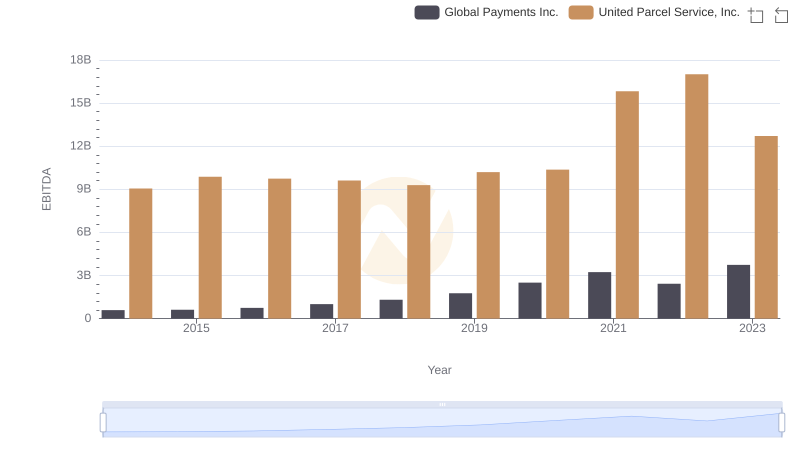
United Parcel Service, Inc. vs Global Payments Inc.: In-Depth EBITDA Performance Comparison
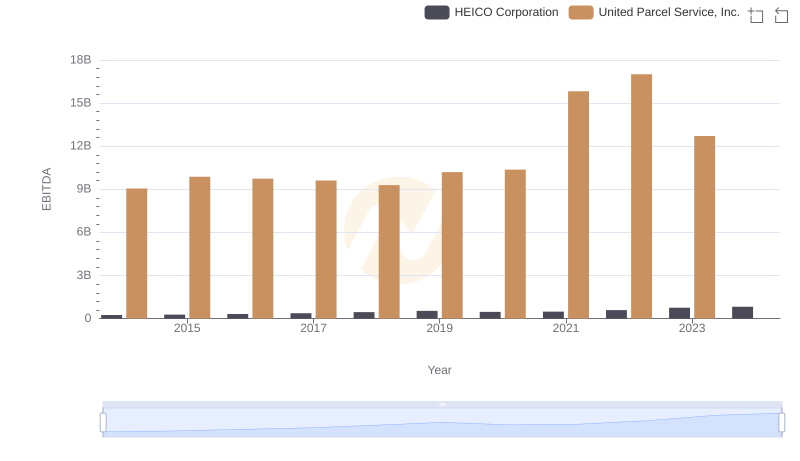
Comparative EBITDA Analysis: United Parcel Service, Inc. vs HEICO Corporation