| __timestamp | United Parcel Service, Inc. | XPO Logistics, Inc. |
|---|---|---|
| Wednesday, January 1, 2014 | 9055000000 | 56600000 |
| Thursday, January 1, 2015 | 9870000000 | 298000000 |
| Friday, January 1, 2016 | 9740000000 | 1108300000 |
| Sunday, January 1, 2017 | 9611000000 | 1196700000 |
| Monday, January 1, 2018 | 9292000000 | 1488000000 |
| Tuesday, January 1, 2019 | 10194000000 | 1594000000 |
| Wednesday, January 1, 2020 | 10366000000 | 727000000 |
| Friday, January 1, 2021 | 15821000000 | 741000000 |
| Saturday, January 1, 2022 | 17005000000 | 941000000 |
| Sunday, January 1, 2023 | 12714000000 | 860000000 |
| Monday, January 1, 2024 | 10185000000 | 1186000000 |
In pursuit of knowledge
In the ever-evolving logistics industry, understanding financial health is crucial. This analysis compares the EBITDA of United Parcel Service, Inc. (UPS) and XPO Logistics, Inc. from 2014 to 2023. Over this period, UPS consistently outperformed XPO, with EBITDA peaking at approximately $17 billion in 2022, a 47% increase from 2014. In contrast, XPO's EBITDA saw a significant rise, reaching its zenith in 2019 with a 2,700% increase from 2014, before stabilizing around $860 million in 2023.
UPS's steady growth reflects its robust market position and strategic investments, while XPO's dramatic early growth highlights its aggressive expansion strategy. However, the recent plateau suggests a need for strategic recalibration. This financial snapshot underscores the dynamic nature of the logistics sector, where adaptability and strategic foresight are key to maintaining competitive advantage.
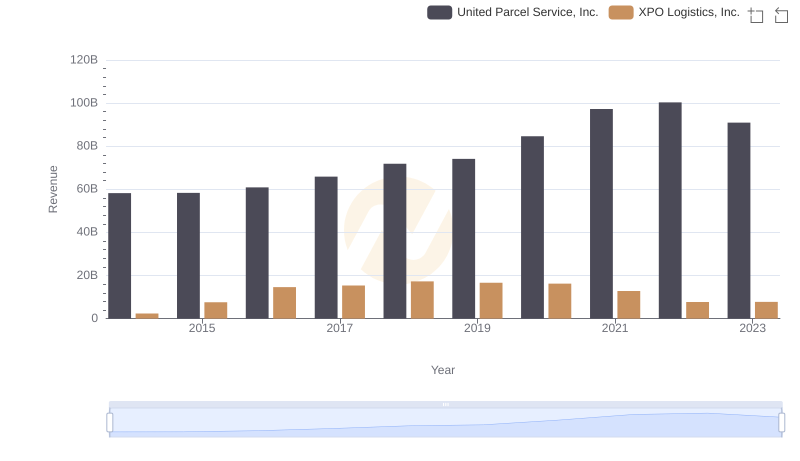
United Parcel Service, Inc. vs XPO Logistics, Inc.: Examining Key Revenue Metrics
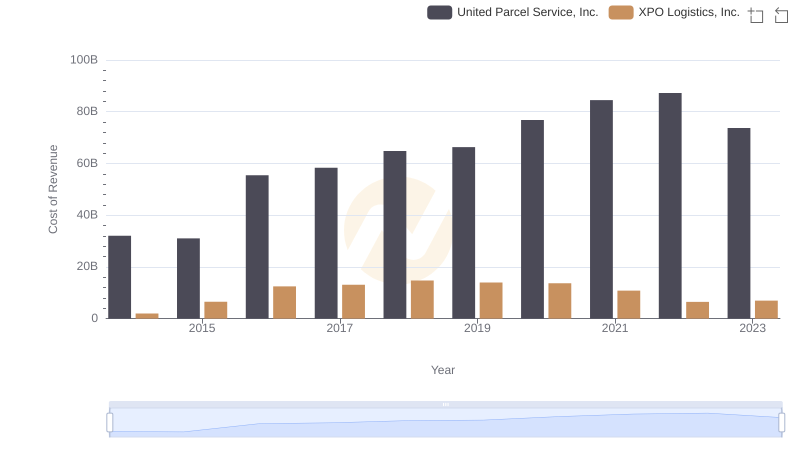
Cost of Revenue: Key Insights for United Parcel Service, Inc. and XPO Logistics, Inc.
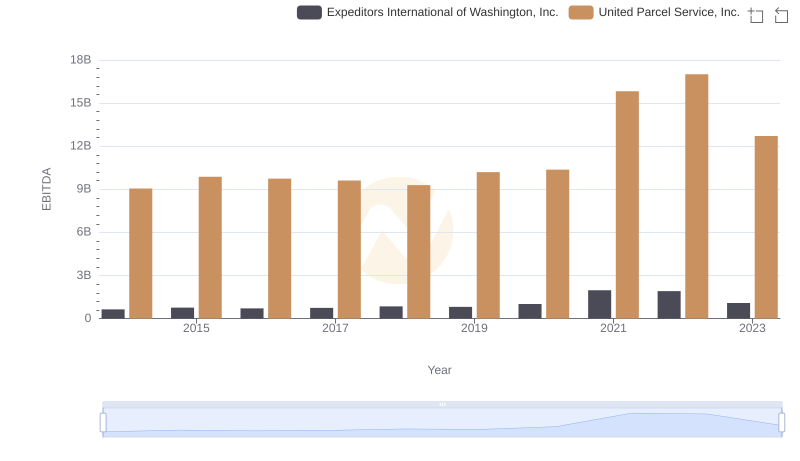
EBITDA Metrics Evaluated: United Parcel Service, Inc. vs Expeditors International of Washington, Inc.
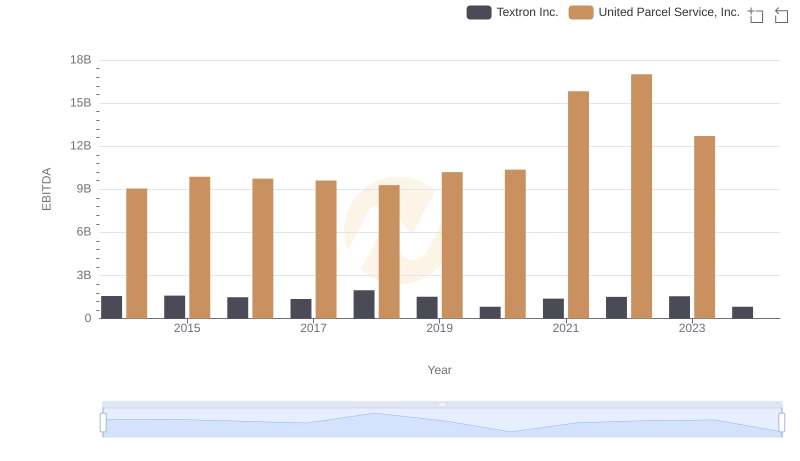
United Parcel Service, Inc. vs Textron Inc.: In-Depth EBITDA Performance Comparison

Key Insights on Gross Profit: United Parcel Service, Inc. vs XPO Logistics, Inc.
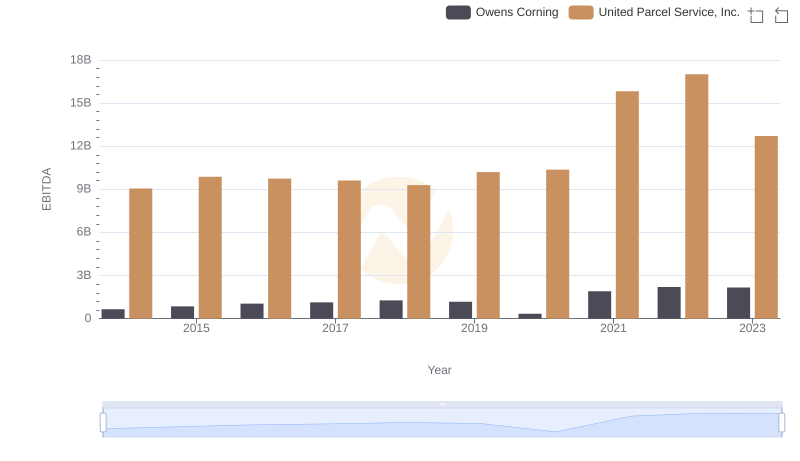
EBITDA Metrics Evaluated: United Parcel Service, Inc. vs Owens Corning
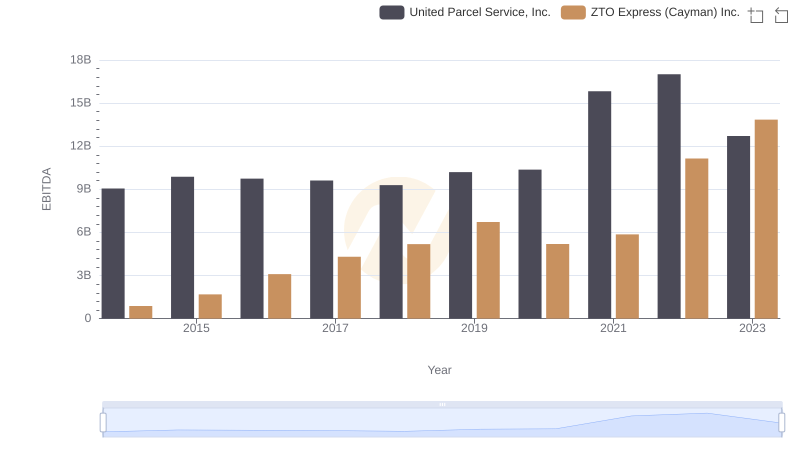
A Professional Review of EBITDA: United Parcel Service, Inc. Compared to ZTO Express (Cayman) Inc.
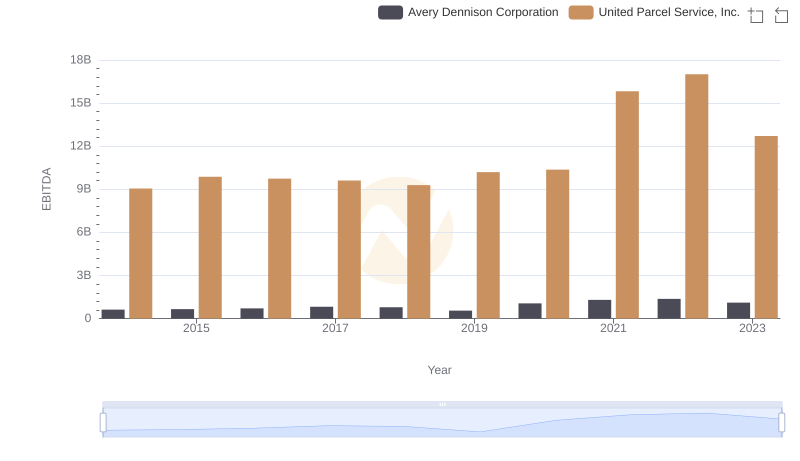
A Side-by-Side Analysis of EBITDA: United Parcel Service, Inc. and Avery Dennison Corporation
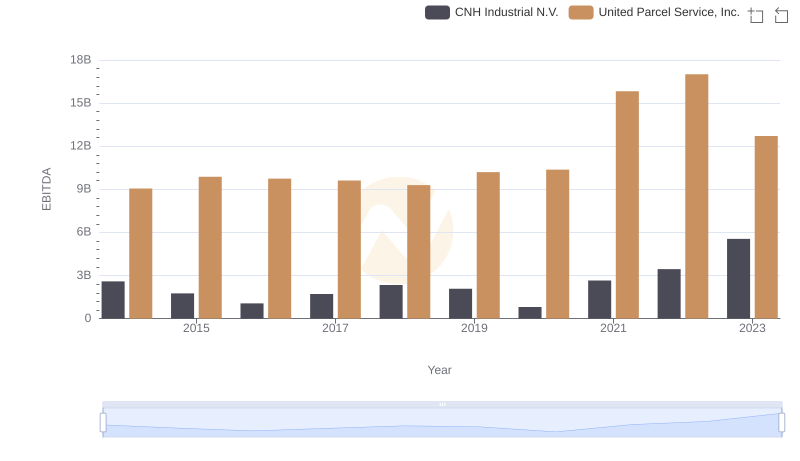
Comprehensive EBITDA Comparison: United Parcel Service, Inc. vs CNH Industrial N.V.

Comprehensive EBITDA Comparison: United Parcel Service, Inc. vs Graco Inc.
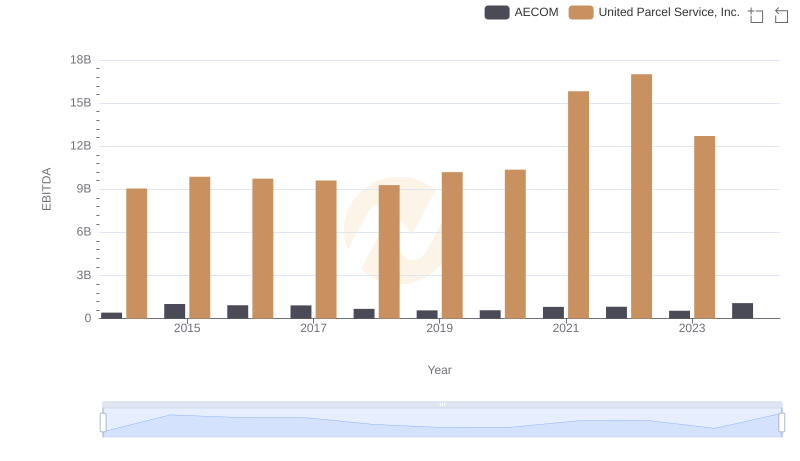
United Parcel Service, Inc. and AECOM: A Detailed Examination of EBITDA Performance
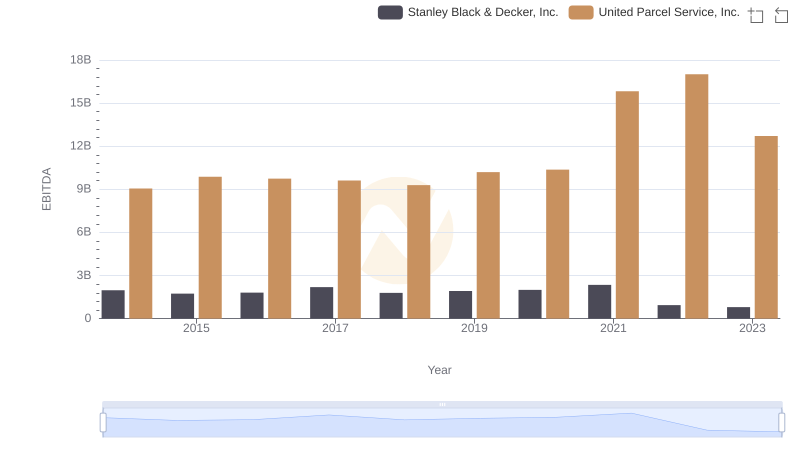
A Professional Review of EBITDA: United Parcel Service, Inc. Compared to Stanley Black & Decker, Inc.