| __timestamp | United Parcel Service, Inc. | XPO Logistics, Inc. |
|---|---|---|
| Wednesday, January 1, 2014 | 32045000000 | 1975000000 |
| Thursday, January 1, 2015 | 31028000000 | 6538400000 |
| Friday, January 1, 2016 | 55439000000 | 12480100000 |
| Sunday, January 1, 2017 | 58343000000 | 13101100000 |
| Monday, January 1, 2018 | 64837000000 | 14738000000 |
| Tuesday, January 1, 2019 | 66296000000 | 13982000000 |
| Wednesday, January 1, 2020 | 76814000000 | 13689000000 |
| Friday, January 1, 2021 | 84477000000 | 10812000000 |
| Saturday, January 1, 2022 | 87244000000 | 6491000000 |
| Sunday, January 1, 2023 | 73727000000 | 6974000000 |
| Monday, January 1, 2024 | 66048000000 | 7157000000 |
Cracking the code
In the ever-evolving logistics industry, understanding cost dynamics is crucial. From 2014 to 2023, United Parcel Service, Inc. (UPS) and XPO Logistics, Inc. have shown distinct trends in their cost of revenue. UPS, a global leader, saw its cost of revenue grow by approximately 130% from 2014 to 2022, peaking in 2022 before a slight decline in 2023. This reflects UPS's strategic investments and operational expansions. Meanwhile, XPO Logistics, a key player in freight transportation, experienced a 250% increase in cost of revenue from 2014 to 2018, followed by fluctuations, indicating adaptive strategies in a competitive market. These insights highlight the companies' responses to market demands and economic shifts, offering a window into their operational efficiencies and challenges. As the logistics landscape continues to change, monitoring these trends provides valuable foresight for stakeholders and investors.
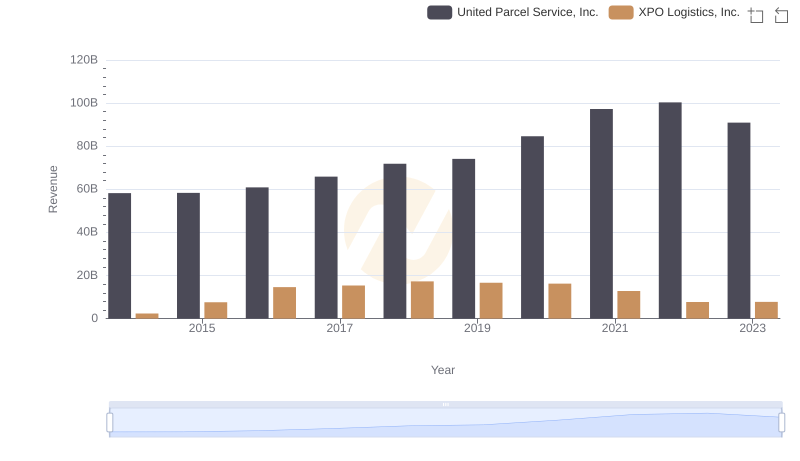
United Parcel Service, Inc. vs XPO Logistics, Inc.: Examining Key Revenue Metrics
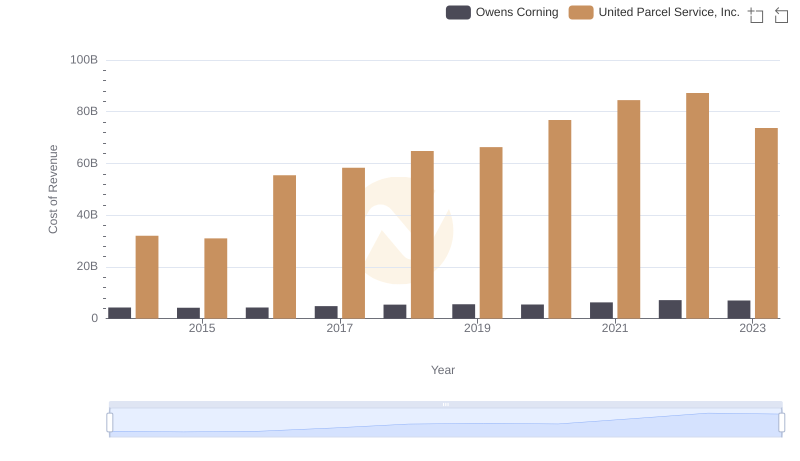
Cost of Revenue Trends: United Parcel Service, Inc. vs Owens Corning
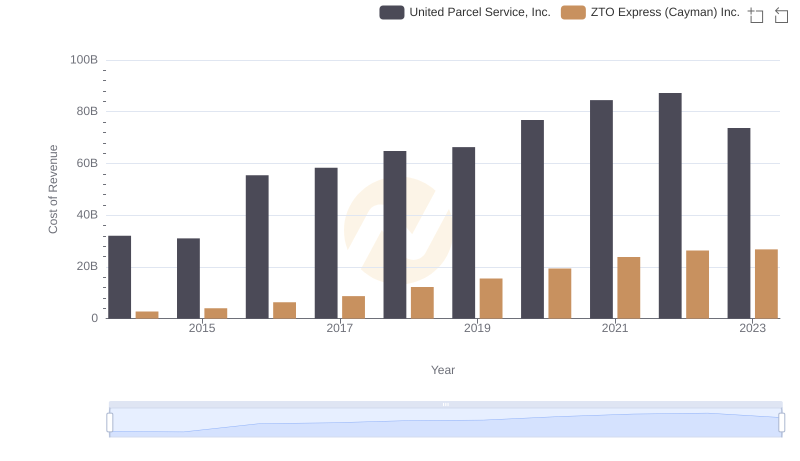
Cost of Revenue Comparison: United Parcel Service, Inc. vs ZTO Express (Cayman) Inc.
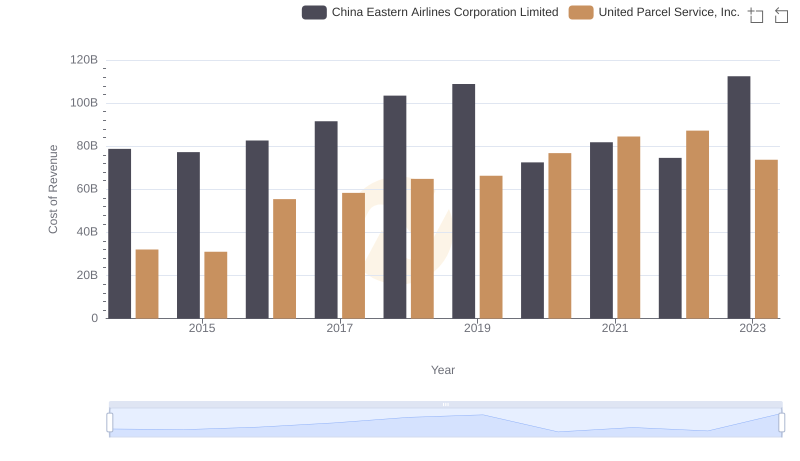
Cost of Revenue Comparison: United Parcel Service, Inc. vs China Eastern Airlines Corporation Limited
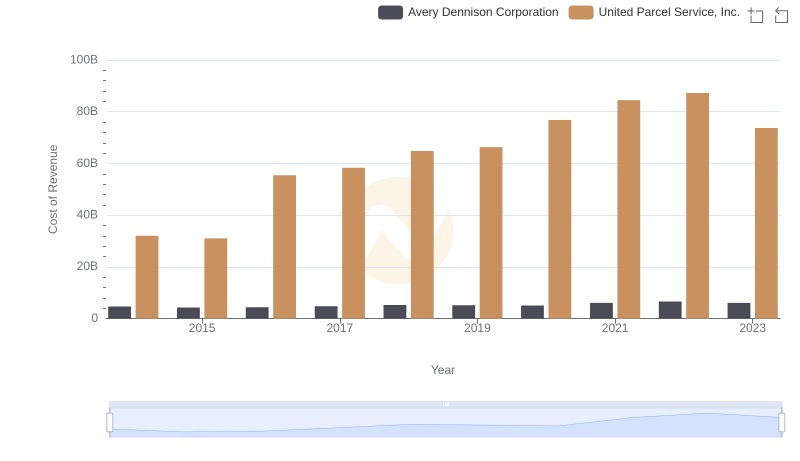
Cost of Revenue Trends: United Parcel Service, Inc. vs Avery Dennison Corporation
Cost Insights: Breaking Down United Parcel Service, Inc. and Graco Inc.'s Expenses
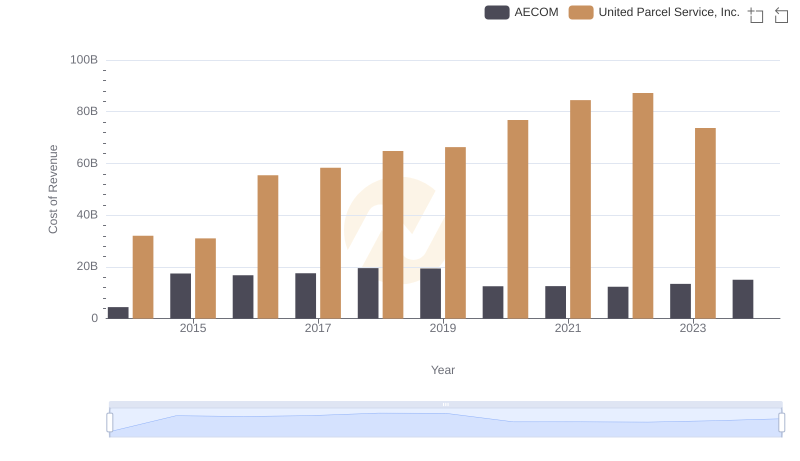
Cost Insights: Breaking Down United Parcel Service, Inc. and AECOM's Expenses
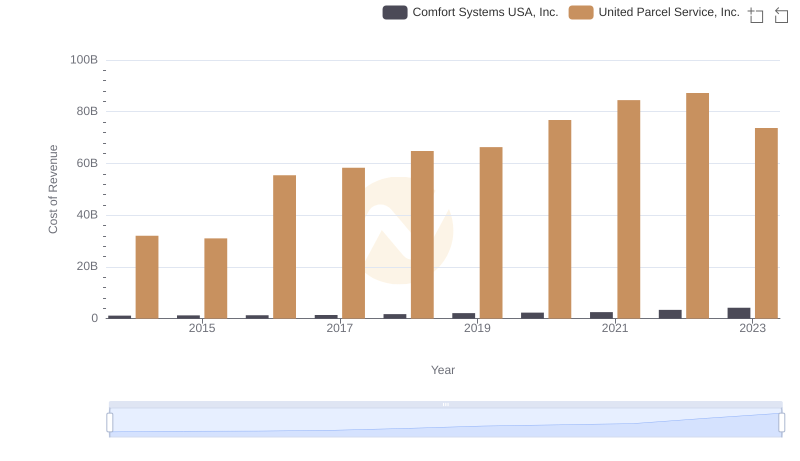
Comparing Cost of Revenue Efficiency: United Parcel Service, Inc. vs Comfort Systems USA, Inc.
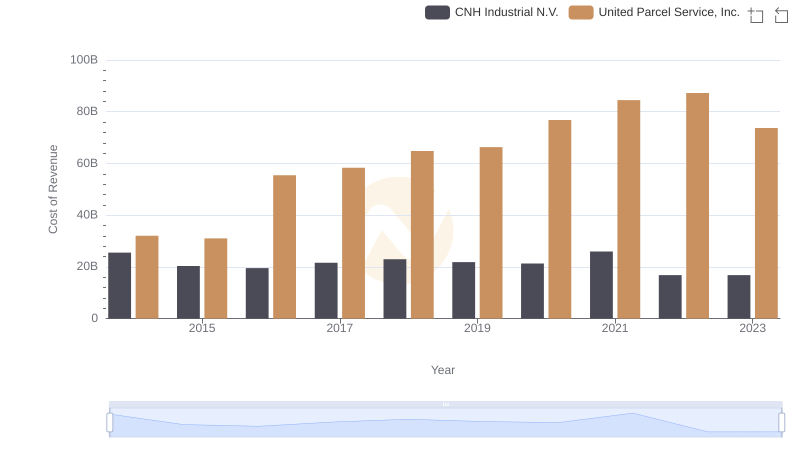
Comparing Cost of Revenue Efficiency: United Parcel Service, Inc. vs CNH Industrial N.V.

Key Insights on Gross Profit: United Parcel Service, Inc. vs XPO Logistics, Inc.

EBITDA Analysis: Evaluating United Parcel Service, Inc. Against XPO Logistics, Inc.