| __timestamp | ASML Holding N.V. | Manhattan Associates, Inc. |
|---|---|---|
| Wednesday, January 1, 2014 | 1455873000 | 133501000 |
| Thursday, January 1, 2015 | 1778800000 | 169210000 |
| Friday, January 1, 2016 | 2083705000 | 203397000 |
| Sunday, January 1, 2017 | 2817900000 | 197626000 |
| Monday, January 1, 2018 | 3384400000 | 142500000 |
| Tuesday, January 1, 2019 | 3243100000 | 123911000 |
| Wednesday, January 1, 2020 | 4526700000 | 123007000 |
| Friday, January 1, 2021 | 6991000000 | 142247000 |
| Saturday, January 1, 2022 | 7157600000 | 159363000 |
| Sunday, January 1, 2023 | 9976000000 | 215633000 |
| Monday, January 1, 2024 | 9941200000 | 267897000 |
Igniting the spark of knowledge
In the ever-evolving landscape of technology and innovation, ASML Holding N.V. and Manhattan Associates, Inc. have showcased remarkable financial trajectories over the past decade. From 2014 to 2023, ASML's EBITDA surged by an impressive 585%, reflecting its dominant position in the semiconductor industry. In contrast, Manhattan Associates, a leader in supply chain solutions, experienced a steady 61% growth in EBITDA during the same period.
ASML's exponential growth, peaking in 2023, underscores its pivotal role in advancing chip manufacturing technologies. Meanwhile, Manhattan Associates' consistent performance highlights its resilience and adaptability in a competitive market. Notably, 2024 data for ASML is missing, leaving room for speculation on its future trajectory.
This analysis not only highlights the financial prowess of these companies but also offers insights into the broader technological advancements shaping our world today.
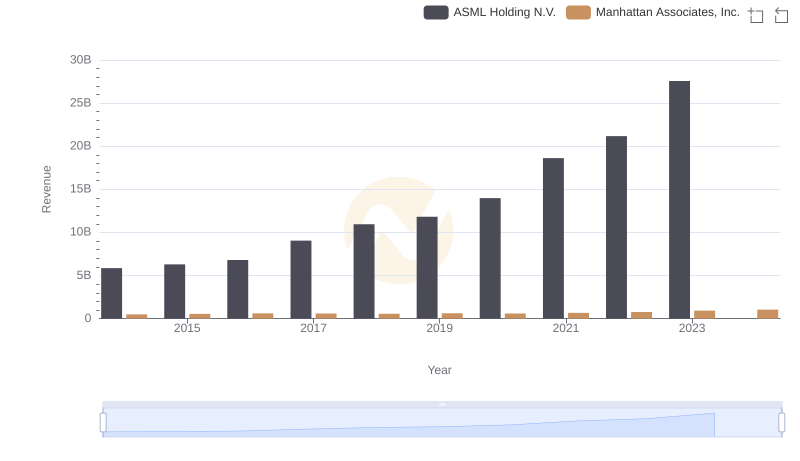
Breaking Down Revenue Trends: ASML Holding N.V. vs Manhattan Associates, Inc.
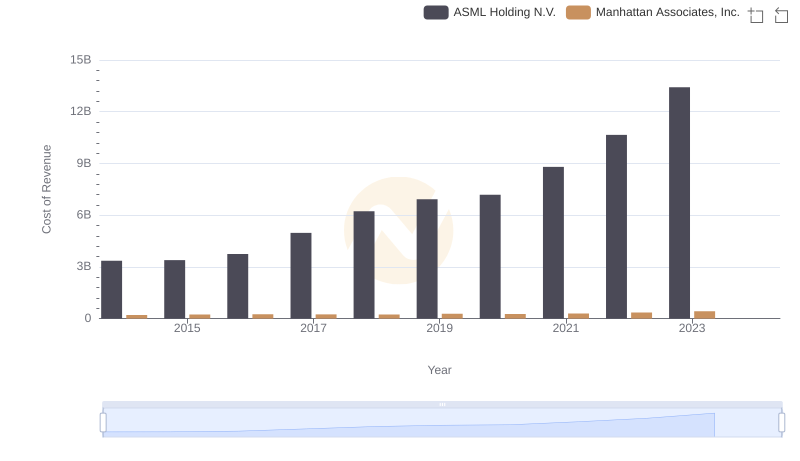
Cost Insights: Breaking Down ASML Holding N.V. and Manhattan Associates, Inc.'s Expenses
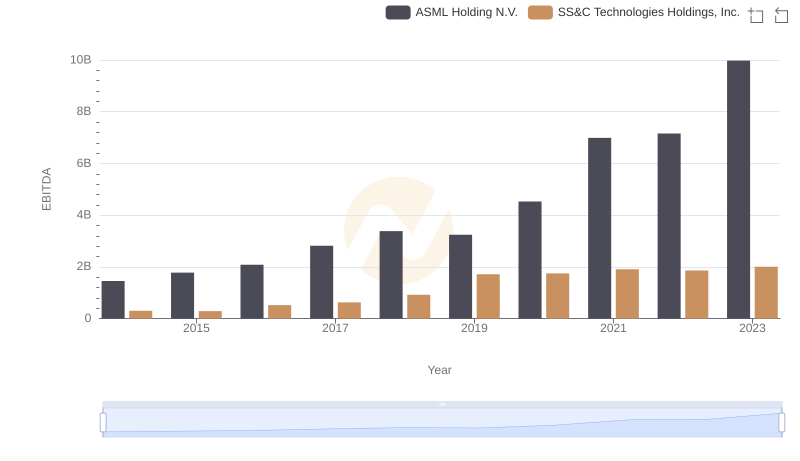
EBITDA Performance Review: ASML Holding N.V. vs SS&C Technologies Holdings, Inc.
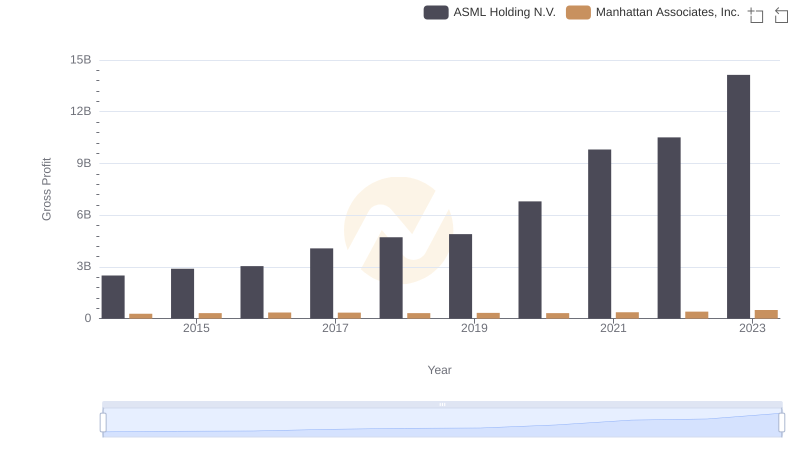
ASML Holding N.V. vs Manhattan Associates, Inc.: A Gross Profit Performance Breakdown
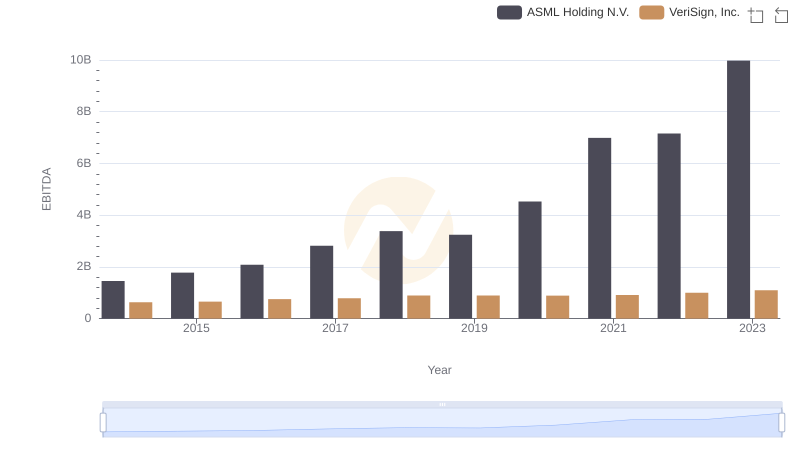
Comprehensive EBITDA Comparison: ASML Holding N.V. vs VeriSign, Inc.
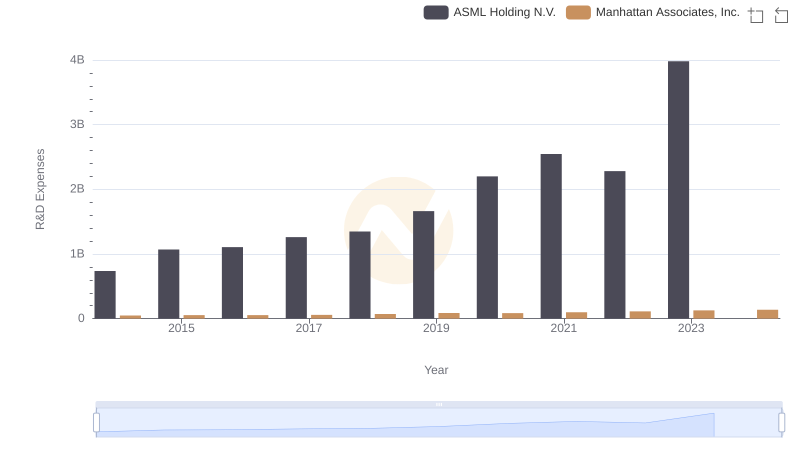
Who Prioritizes Innovation? R&D Spending Compared for ASML Holding N.V. and Manhattan Associates, Inc.
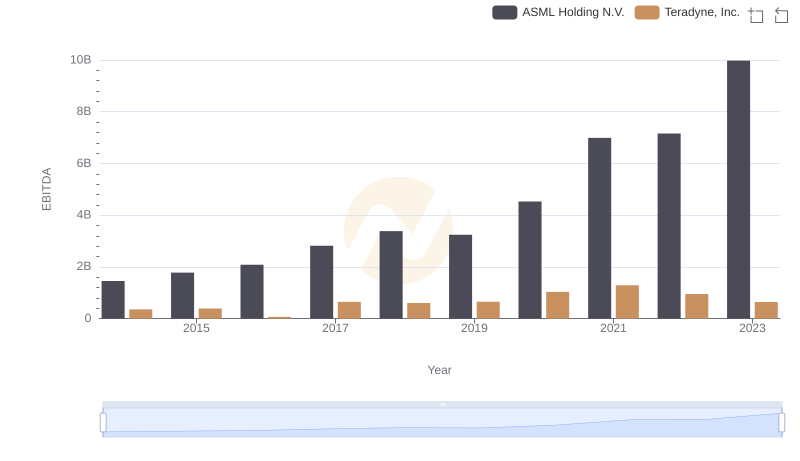
EBITDA Performance Review: ASML Holding N.V. vs Teradyne, Inc.
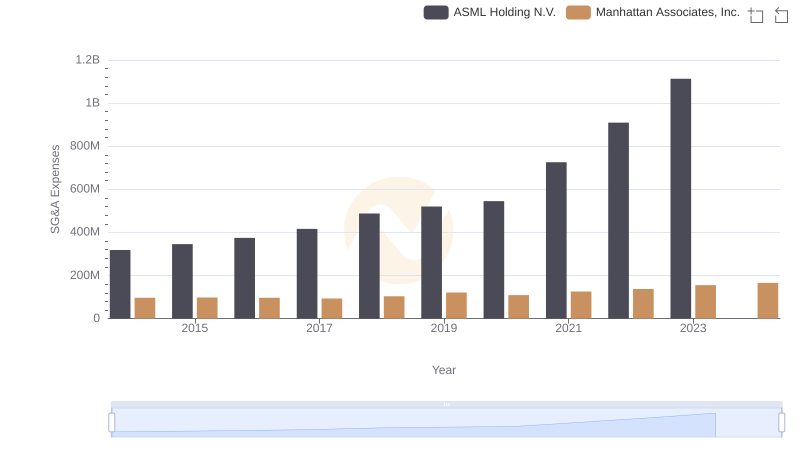
Operational Costs Compared: SG&A Analysis of ASML Holding N.V. and Manhattan Associates, Inc.
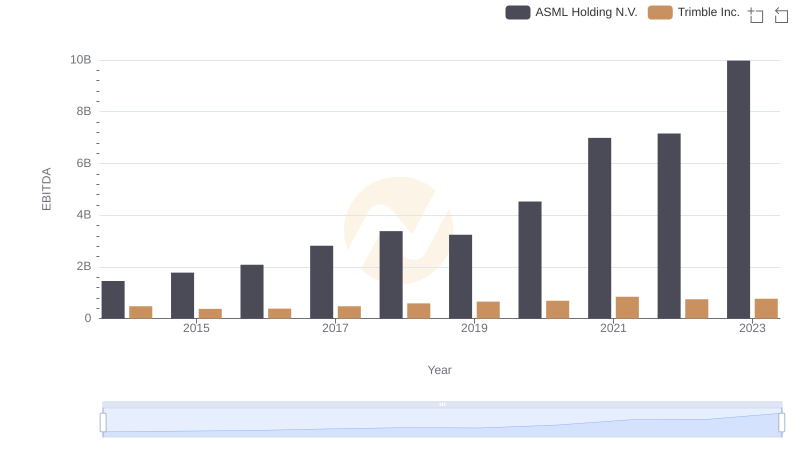
ASML Holding N.V. vs Trimble Inc.: In-Depth EBITDA Performance Comparison
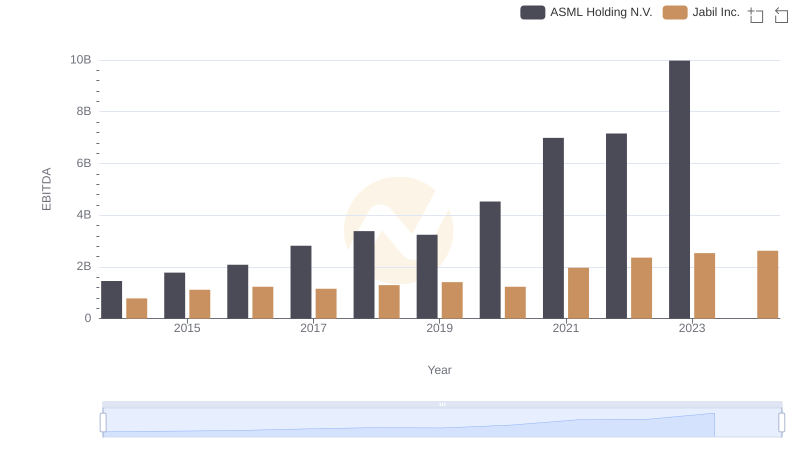
A Side-by-Side Analysis of EBITDA: ASML Holding N.V. and Jabil Inc.
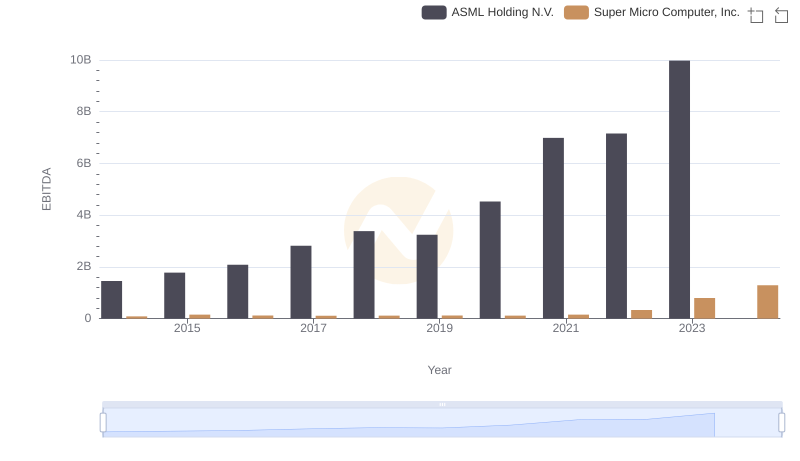
Comparative EBITDA Analysis: ASML Holding N.V. vs Super Micro Computer, Inc.
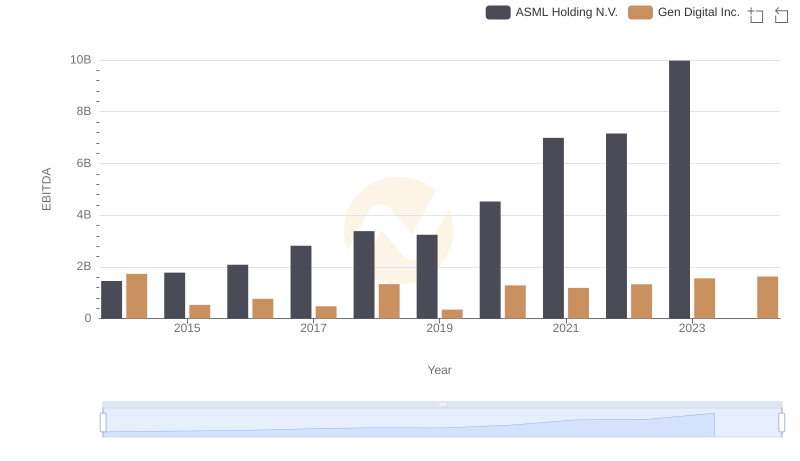
EBITDA Performance Review: ASML Holding N.V. vs Gen Digital Inc.