| __timestamp | ASML Holding N.V. | Jabil Inc. |
|---|---|---|
| Wednesday, January 1, 2014 | 1455873000 | 784683000 |
| Thursday, January 1, 2015 | 1778800000 | 1117653000 |
| Friday, January 1, 2016 | 2083705000 | 1230954000 |
| Sunday, January 1, 2017 | 2817900000 | 1154687000 |
| Monday, January 1, 2018 | 3384400000 | 1296106000 |
| Tuesday, January 1, 2019 | 3243100000 | 1412990000 |
| Wednesday, January 1, 2020 | 4526700000 | 1230298000 |
| Friday, January 1, 2021 | 6991000000 | 1966000000 |
| Saturday, January 1, 2022 | 7157600000 | 2358000000 |
| Sunday, January 1, 2023 | 9976000000 | 2533000000 |
| Monday, January 1, 2024 | 9941200000 | 2623000000 |
In pursuit of knowledge
In the ever-evolving landscape of global technology and manufacturing, ASML Holding N.V. and Jabil Inc. stand as titans of industry. Over the past decade, ASML has demonstrated a remarkable growth trajectory, with its EBITDA surging by approximately 586% from 2014 to 2023. This growth underscores ASML's pivotal role in the semiconductor industry, driven by its cutting-edge lithography technology. In contrast, Jabil Inc., a leader in manufacturing solutions, has seen its EBITDA grow by around 223% over the same period, reflecting its strategic diversification and operational efficiency.
This analysis provides a window into the financial health and strategic direction of these industry leaders.
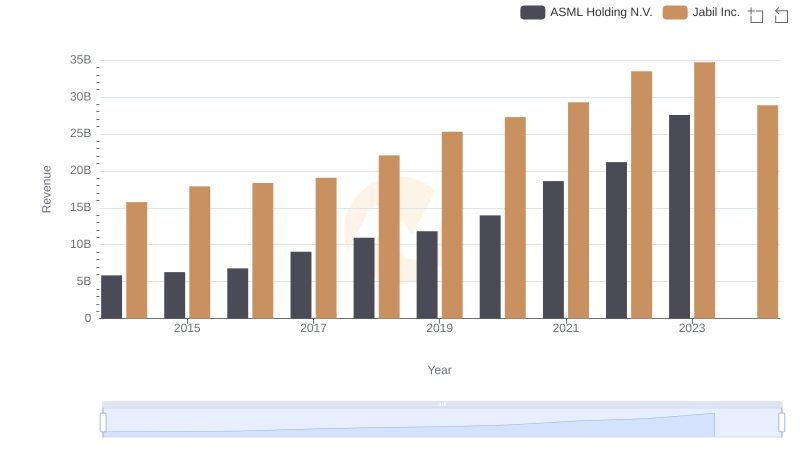
ASML Holding N.V. vs Jabil Inc.: Examining Key Revenue Metrics

Cost Insights: Breaking Down ASML Holding N.V. and Jabil Inc.'s Expenses
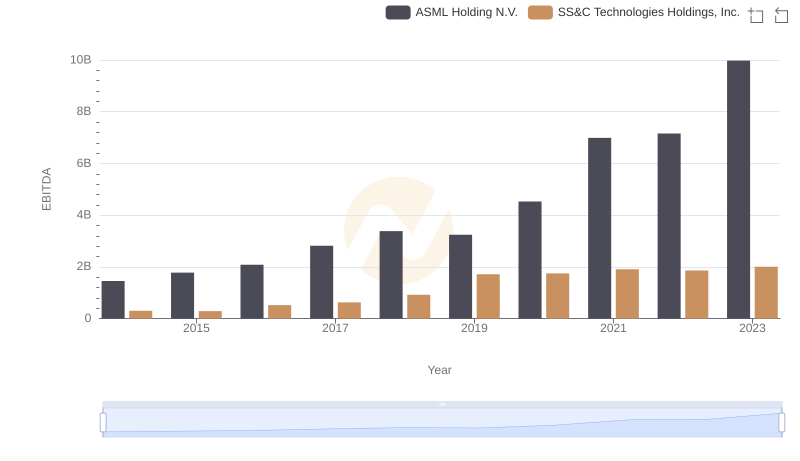
EBITDA Performance Review: ASML Holding N.V. vs SS&C Technologies Holdings, Inc.
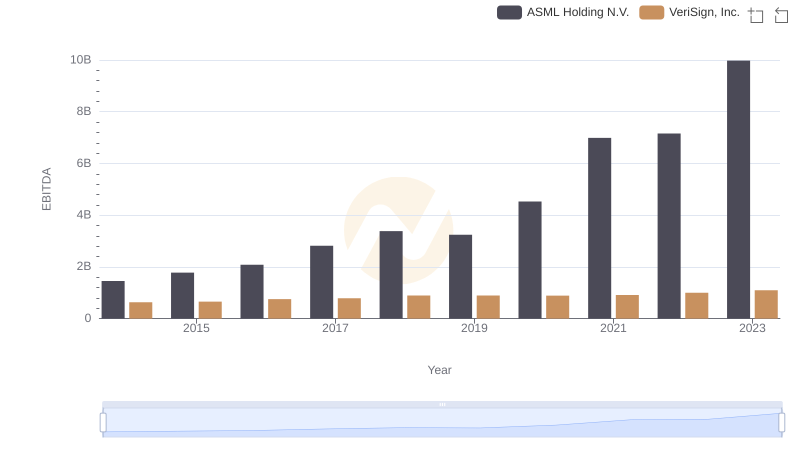
Comprehensive EBITDA Comparison: ASML Holding N.V. vs VeriSign, Inc.
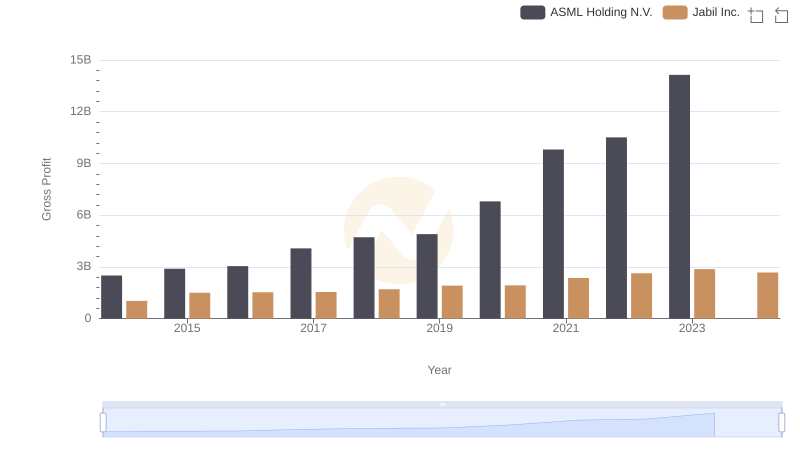
Gross Profit Comparison: ASML Holding N.V. and Jabil Inc. Trends
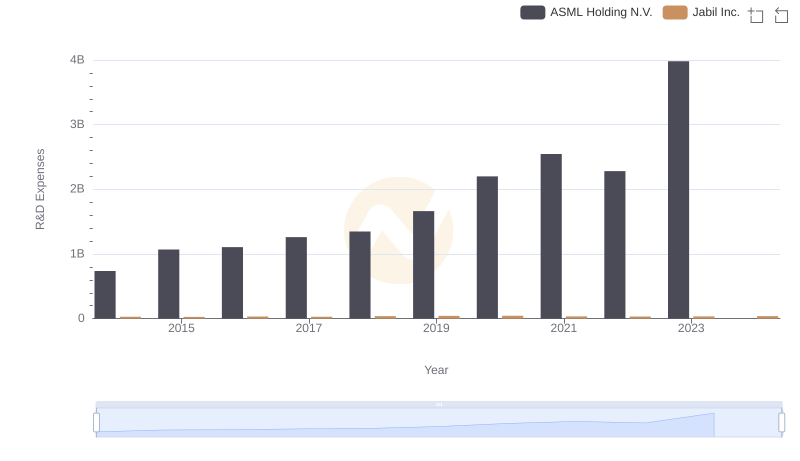
Who Prioritizes Innovation? R&D Spending Compared for ASML Holding N.V. and Jabil Inc.
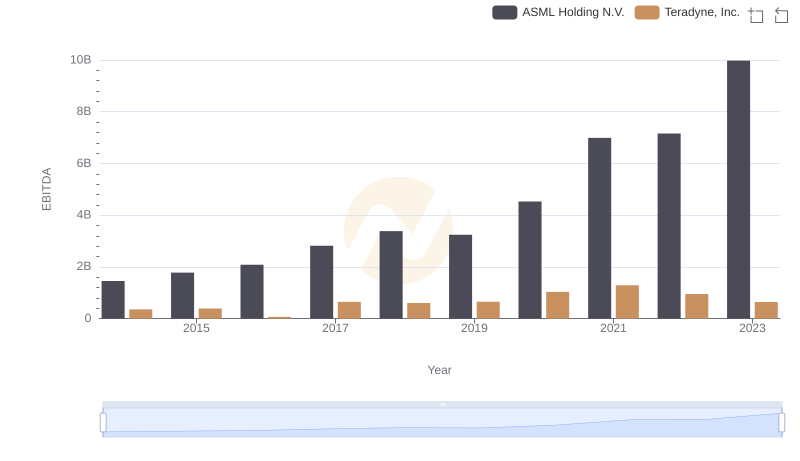
EBITDA Performance Review: ASML Holding N.V. vs Teradyne, Inc.
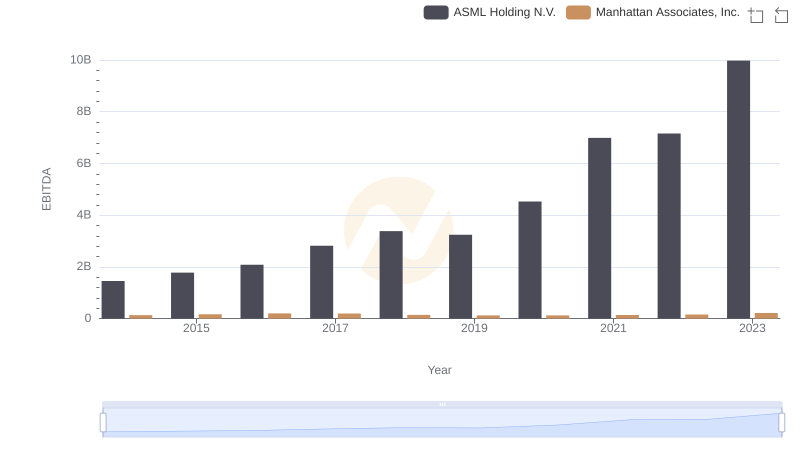
EBITDA Analysis: Evaluating ASML Holding N.V. Against Manhattan Associates, Inc.
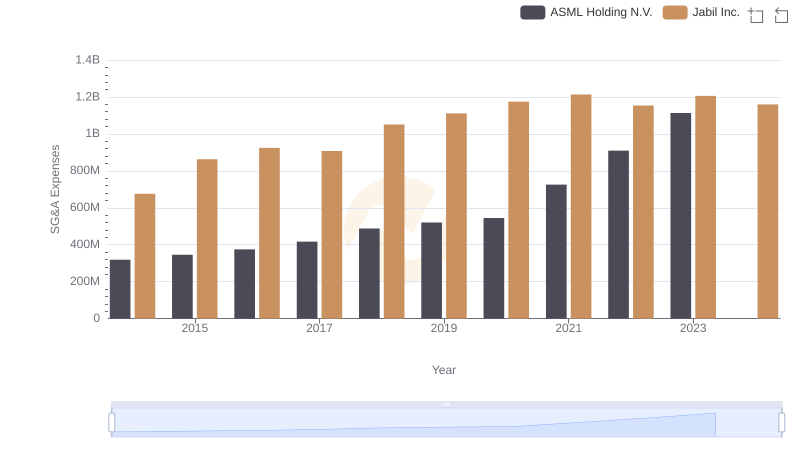
Selling, General, and Administrative Costs: ASML Holding N.V. vs Jabil Inc.
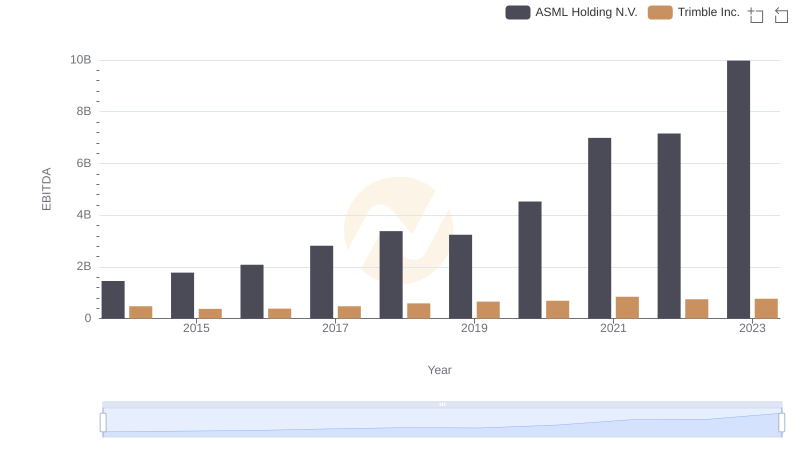
ASML Holding N.V. vs Trimble Inc.: In-Depth EBITDA Performance Comparison
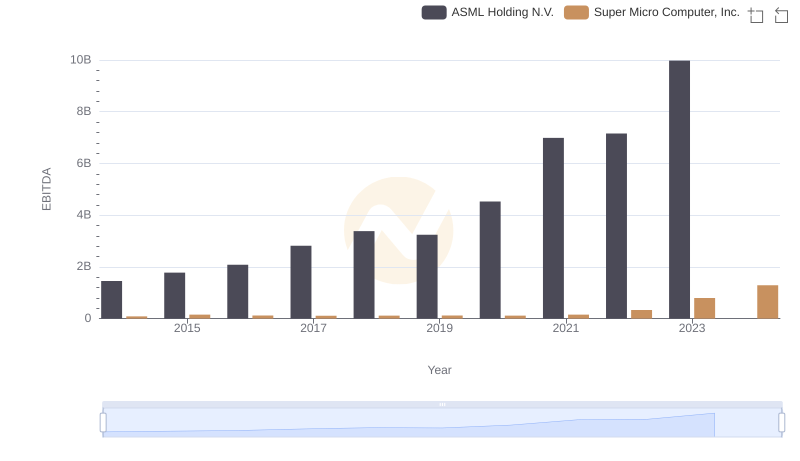
Comparative EBITDA Analysis: ASML Holding N.V. vs Super Micro Computer, Inc.
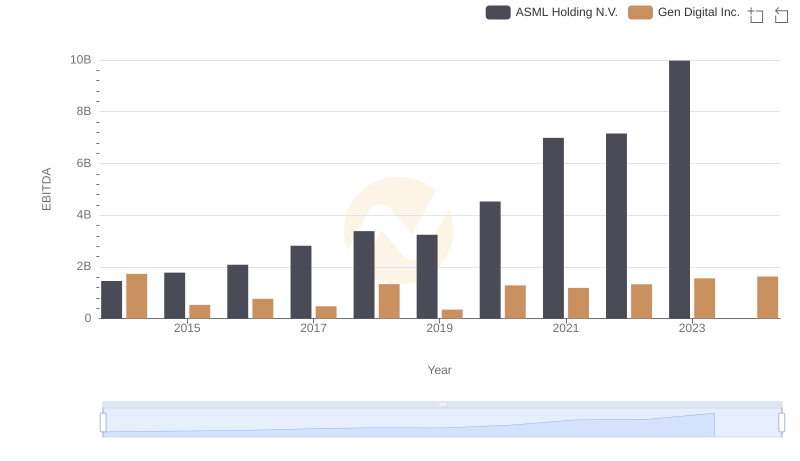
EBITDA Performance Review: ASML Holding N.V. vs Gen Digital Inc.