| __timestamp | Deere & Company | Graco Inc. |
|---|---|---|
| Wednesday, January 1, 2014 | 10466900000 | 666736000 |
| Thursday, January 1, 2015 | 8013100000 | 684700000 |
| Friday, January 1, 2016 | 7649600000 | 708239000 |
| Sunday, January 1, 2017 | 8683100000 | 793049000 |
| Monday, January 1, 2018 | 10886100000 | 882539000 |
| Tuesday, January 1, 2019 | 11587000000 | 859756000 |
| Wednesday, January 1, 2020 | 11045000000 | 854937000 |
| Friday, January 1, 2021 | 13917000000 | 1033949000 |
| Saturday, January 1, 2022 | 17239000000 | 1057439000 |
| Sunday, January 1, 2023 | 21117000000 | 1161021000 |
| Monday, January 1, 2024 | 13984000000 | 1122461000 |
In pursuit of knowledge
In the ever-evolving landscape of industrial manufacturing, Deere & Company and Graco Inc. have showcased remarkable financial trajectories over the past decade. Deere & Company, a titan in agricultural machinery, has seen its gross profit soar by approximately 102% from 2014 to 2023. This growth reflects its strategic innovations and market expansion. In contrast, Graco Inc., a leader in fluid handling systems, experienced a steady 74% increase in gross profit during the same period, underscoring its resilience and adaptability in a competitive market.
The year 2023 marked a pinnacle for both companies, with Deere & Company achieving its highest gross profit, while Graco Inc. continued its upward trend. As we look to the future, these financial insights provide a compelling narrative of growth and sustainability in the industrial sector.
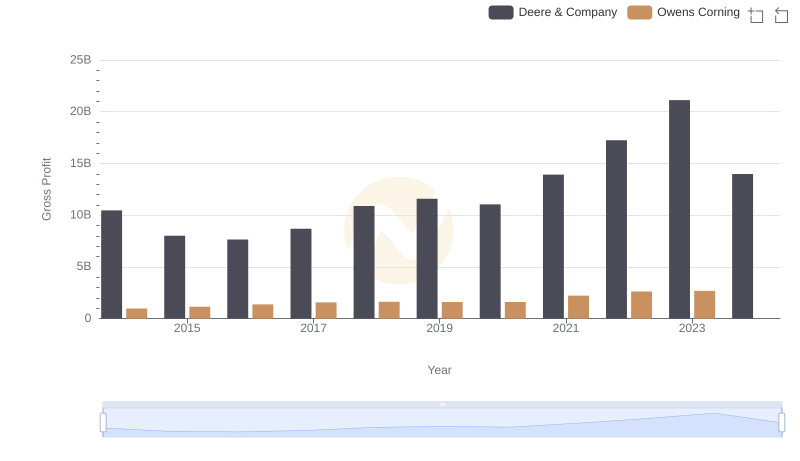
Key Insights on Gross Profit: Deere & Company vs Owens Corning
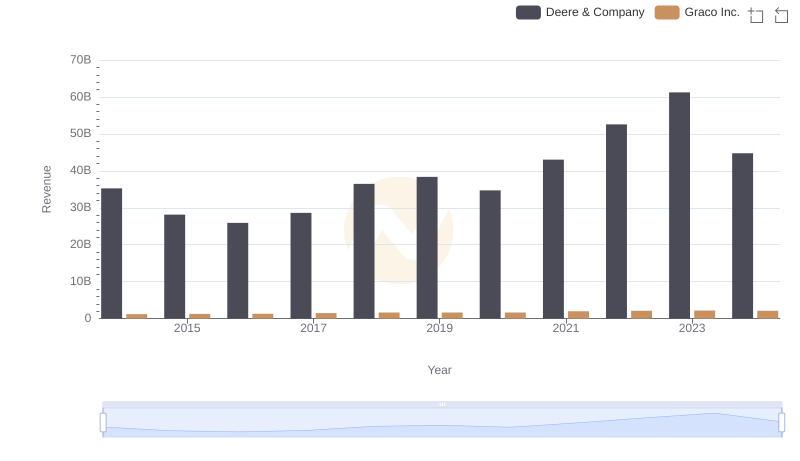
Breaking Down Revenue Trends: Deere & Company vs Graco Inc.
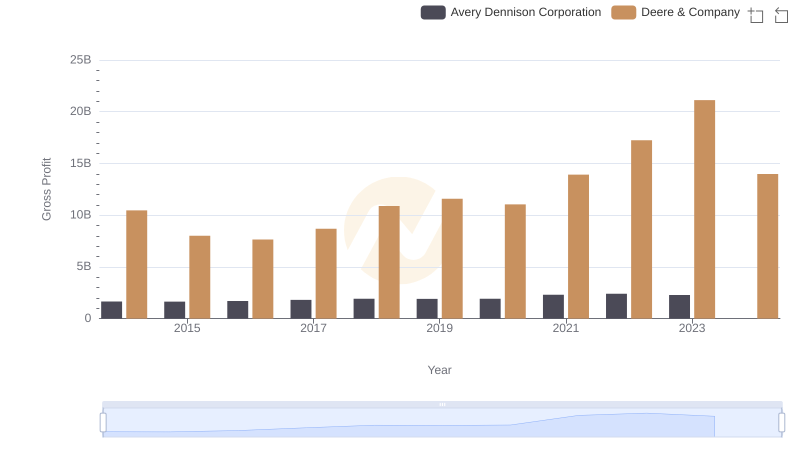
Who Generates Higher Gross Profit? Deere & Company or Avery Dennison Corporation
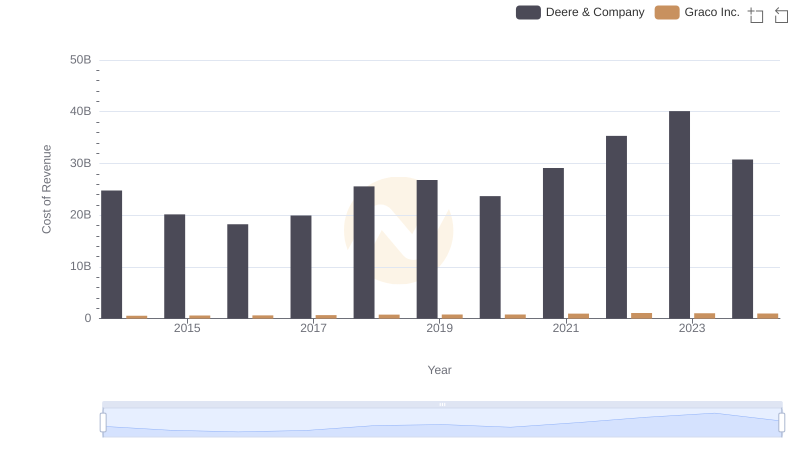
Cost of Revenue Comparison: Deere & Company vs Graco Inc.
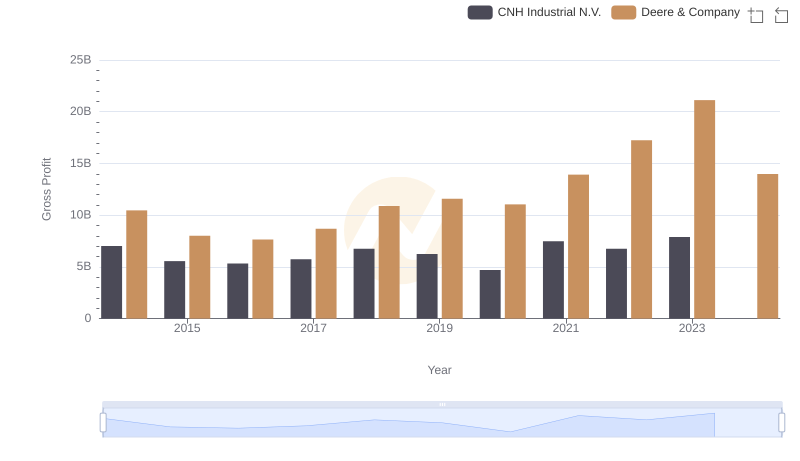
Deere & Company and CNH Industrial N.V.: A Detailed Gross Profit Analysis
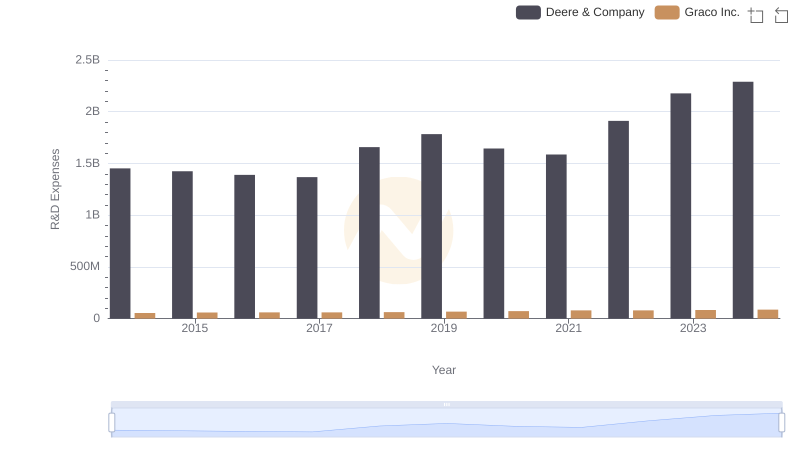
Who Prioritizes Innovation? R&D Spending Compared for Deere & Company and Graco Inc.
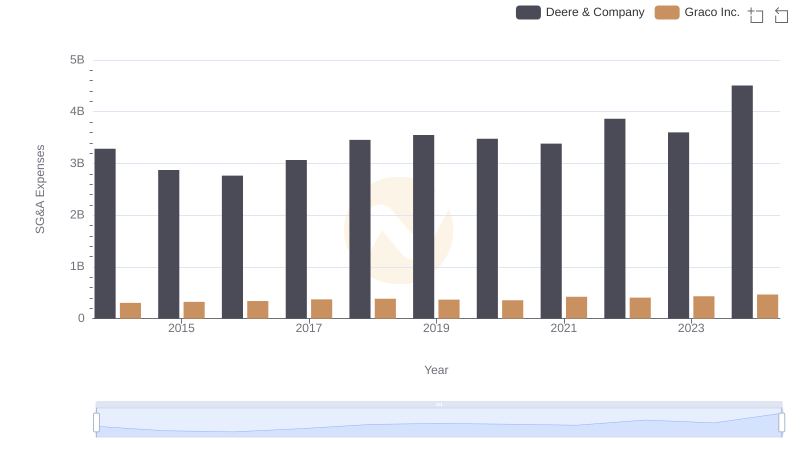
Cost Management Insights: SG&A Expenses for Deere & Company and Graco Inc.
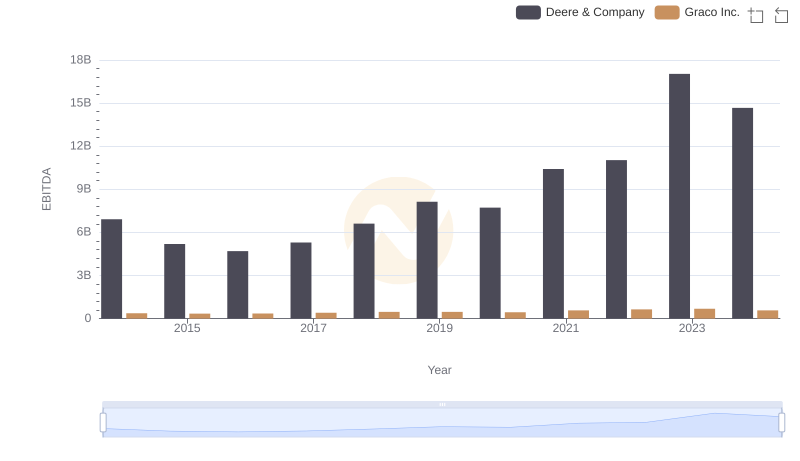
Comparative EBITDA Analysis: Deere & Company vs Graco Inc.