| __timestamp | Parker-Hannifin Corporation | United Parcel Service, Inc. |
|---|---|---|
| Wednesday, January 1, 2014 | 10188227000 | 32045000000 |
| Thursday, January 1, 2015 | 9655245000 | 31028000000 |
| Friday, January 1, 2016 | 8823384000 | 55439000000 |
| Sunday, January 1, 2017 | 9188962000 | 58343000000 |
| Monday, January 1, 2018 | 10762841000 | 64837000000 |
| Tuesday, January 1, 2019 | 10703484000 | 66296000000 |
| Wednesday, January 1, 2020 | 10286518000 | 76814000000 |
| Friday, January 1, 2021 | 10449680000 | 84477000000 |
| Saturday, January 1, 2022 | 11387267000 | 87244000000 |
| Sunday, January 1, 2023 | 12635892000 | 73727000000 |
| Monday, January 1, 2024 | 12801816000 | 66048000000 |
Unveiling the hidden dimensions of data
In the ever-evolving landscape of logistics and manufacturing, United Parcel Service, Inc. (UPS) and Parker-Hannifin Corporation have been pivotal players. From 2014 to 2023, UPS's cost of revenue surged by approximately 130%, peaking in 2022. This reflects the company's aggressive expansion and adaptation to the e-commerce boom. However, 2023 saw a dip, indicating potential operational efficiencies or market challenges.
Conversely, Parker-Hannifin's cost of revenue exhibited a steady upward trend, growing by about 26% over the same period. This growth underscores the company's resilience and strategic investments in automation and innovation. Notably, 2024 data for UPS is missing, hinting at potential reporting delays or strategic shifts.
These trends highlight the dynamic nature of these industries, where adaptability and strategic foresight are key to maintaining competitive advantage.
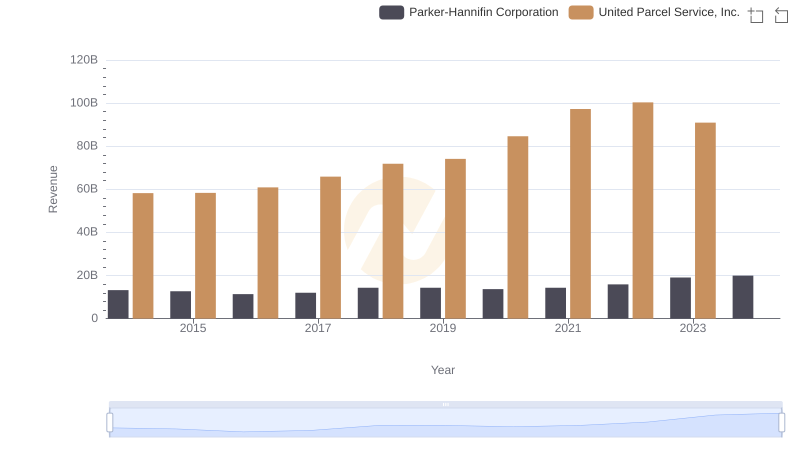
United Parcel Service, Inc. vs Parker-Hannifin Corporation: Examining Key Revenue Metrics
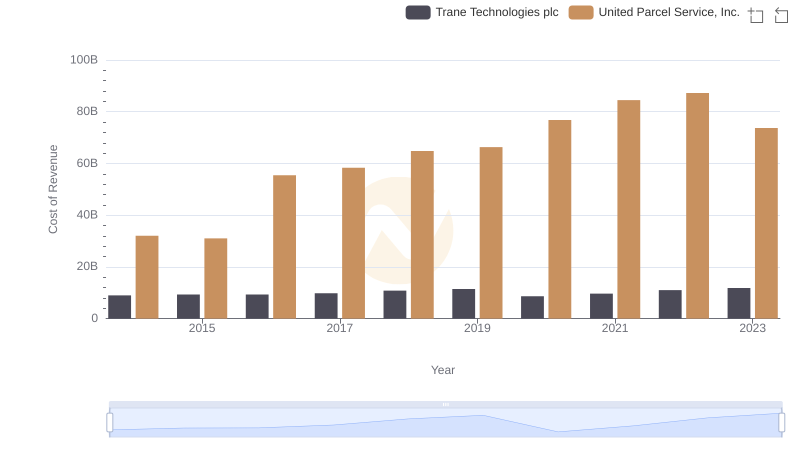
Cost Insights: Breaking Down United Parcel Service, Inc. and Trane Technologies plc's Expenses
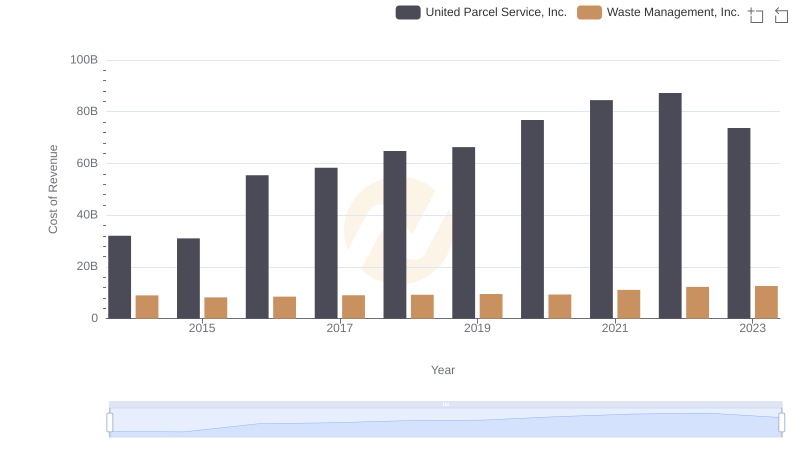
Cost of Revenue Trends: United Parcel Service, Inc. vs Waste Management, Inc.
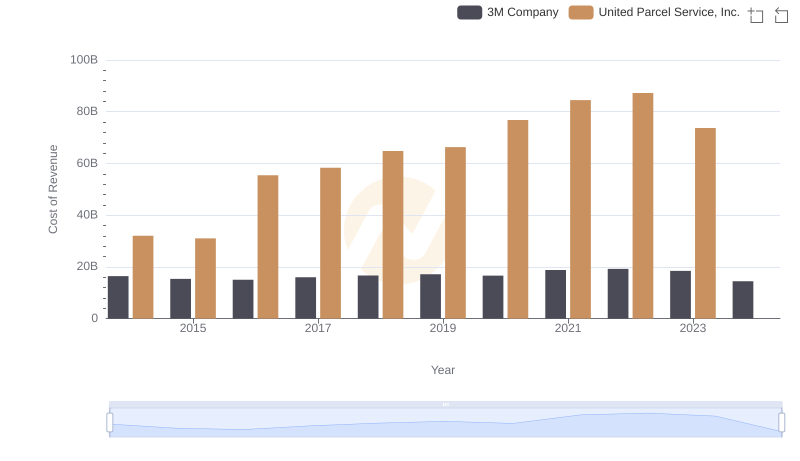
Cost of Revenue Comparison: United Parcel Service, Inc. vs 3M Company
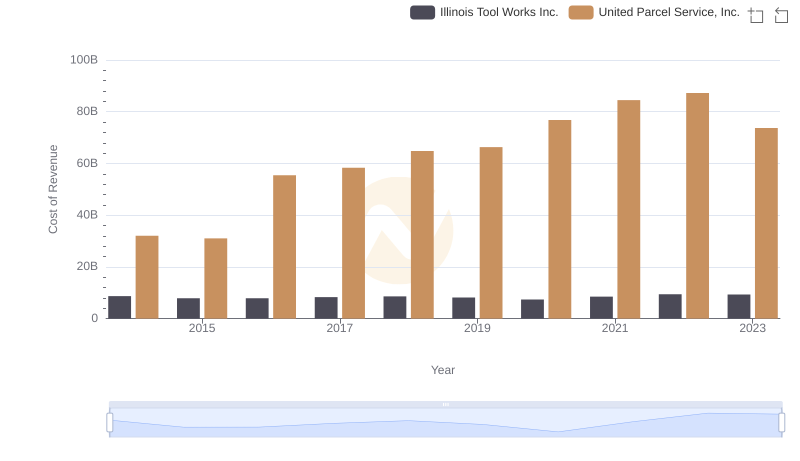
Cost of Revenue Trends: United Parcel Service, Inc. vs Illinois Tool Works Inc.
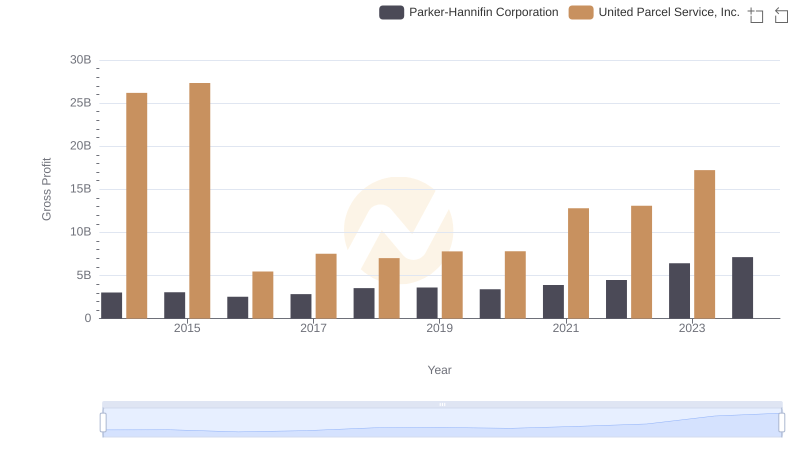
Gross Profit Comparison: United Parcel Service, Inc. and Parker-Hannifin Corporation Trends
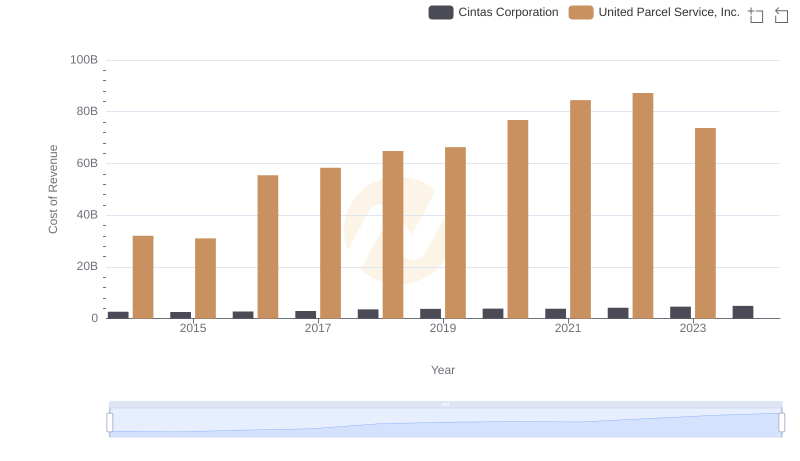
United Parcel Service, Inc. vs Cintas Corporation: Efficiency in Cost of Revenue Explored
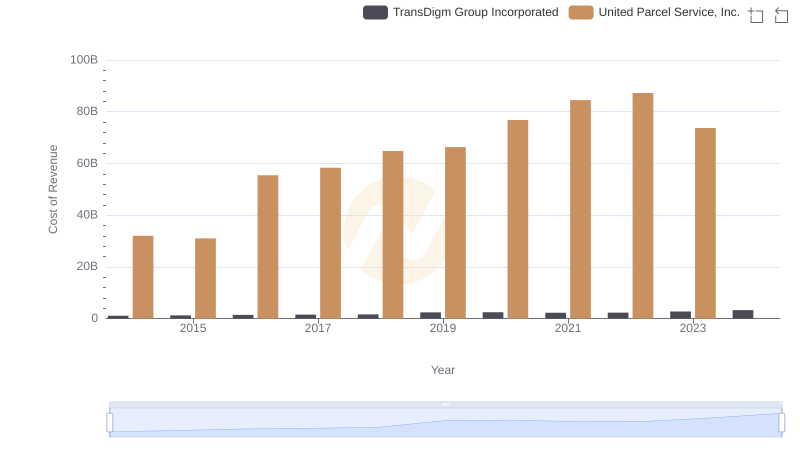
Cost of Revenue: Key Insights for United Parcel Service, Inc. and TransDigm Group Incorporated
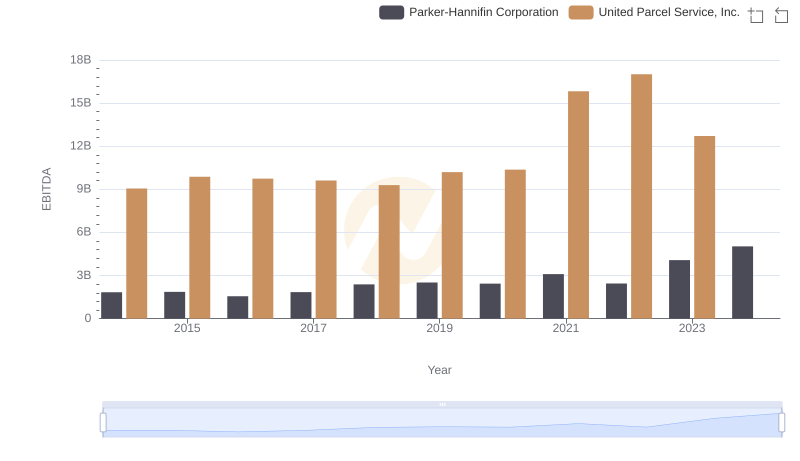
United Parcel Service, Inc. vs Parker-Hannifin Corporation: In-Depth EBITDA Performance Comparison
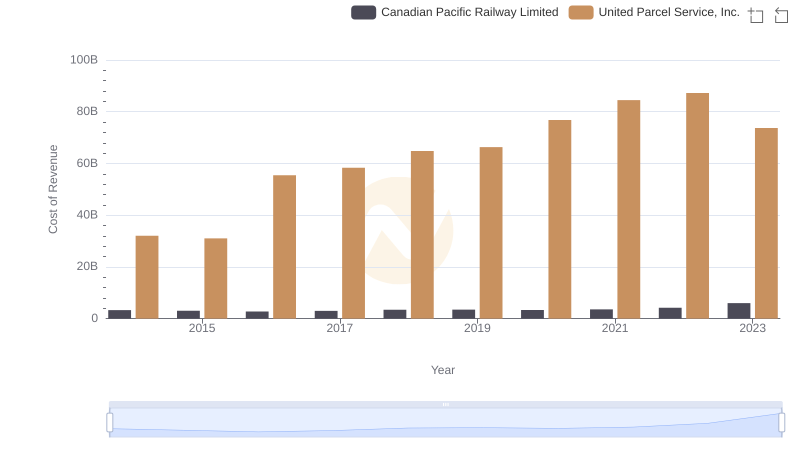
Cost of Revenue Trends: United Parcel Service, Inc. vs Canadian Pacific Railway Limited
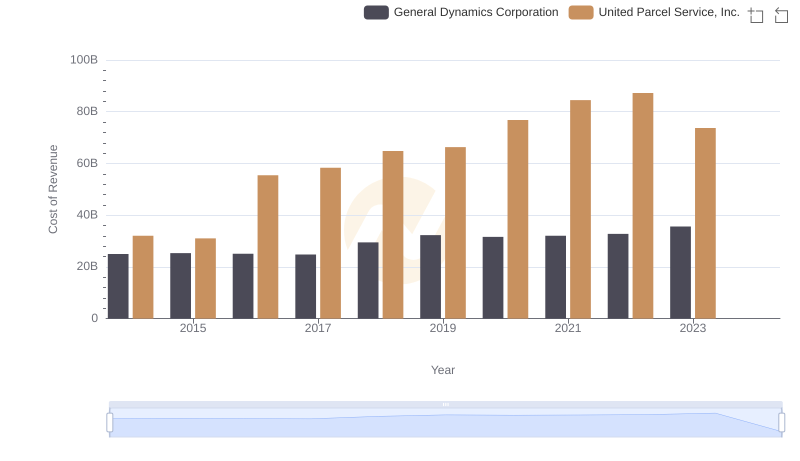
United Parcel Service, Inc. vs General Dynamics Corporation: Efficiency in Cost of Revenue Explored
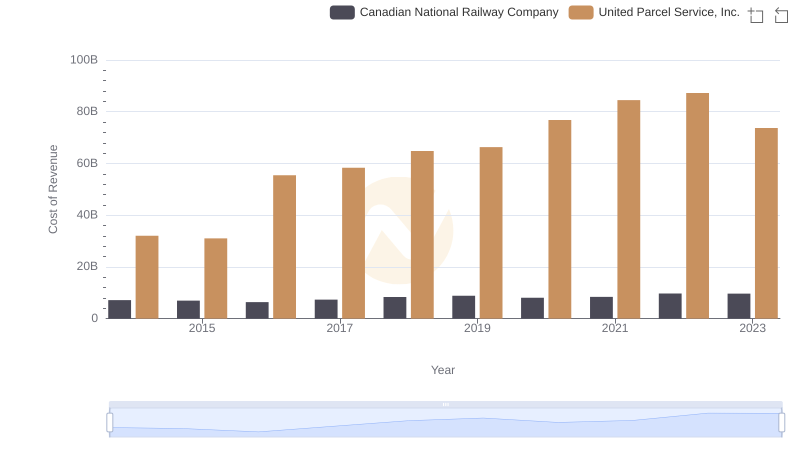
Cost of Revenue Trends: United Parcel Service, Inc. vs Canadian National Railway Company