| __timestamp | Canadian Pacific Railway Limited | United Parcel Service, Inc. |
|---|---|---|
| Wednesday, January 1, 2014 | 3300000000 | 32045000000 |
| Thursday, January 1, 2015 | 3032000000 | 31028000000 |
| Friday, January 1, 2016 | 2749000000 | 55439000000 |
| Sunday, January 1, 2017 | 2979000000 | 58343000000 |
| Monday, January 1, 2018 | 3413000000 | 64837000000 |
| Tuesday, January 1, 2019 | 3475000000 | 66296000000 |
| Wednesday, January 1, 2020 | 3349000000 | 76814000000 |
| Friday, January 1, 2021 | 3571000000 | 84477000000 |
| Saturday, January 1, 2022 | 4223000000 | 87244000000 |
| Sunday, January 1, 2023 | 5968000000 | 73727000000 |
| Monday, January 1, 2024 | 7003000000 | 66048000000 |
Infusing magic into the data realm
In the ever-evolving landscape of logistics and transportation, understanding cost dynamics is crucial. Over the past decade, United Parcel Service, Inc. (UPS) and Canadian Pacific Railway Limited have showcased distinct trends in their cost of revenue. From 2014 to 2023, UPS's cost of revenue surged by approximately 130%, peaking in 2022, reflecting its expansive global operations and increased demand for parcel delivery. In contrast, Canadian Pacific Railway's cost of revenue grew by about 80%, with a notable spike in 2023, possibly due to strategic expansions and infrastructure investments.
These trends highlight the differing operational challenges and opportunities faced by these industry giants.
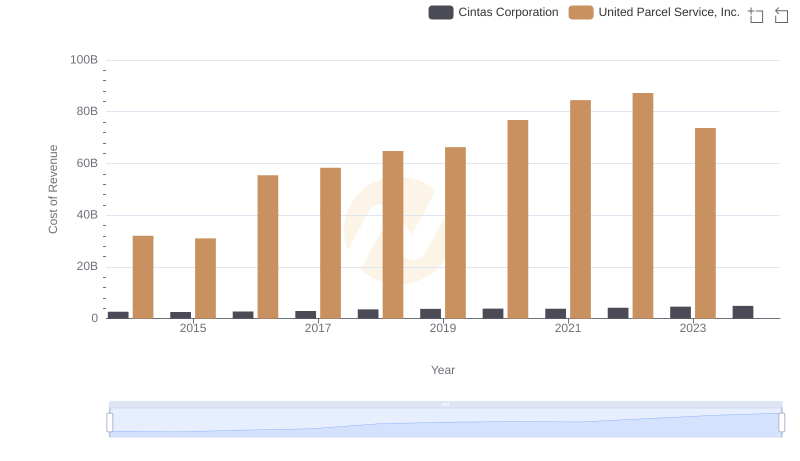
United Parcel Service, Inc. vs Cintas Corporation: Efficiency in Cost of Revenue Explored
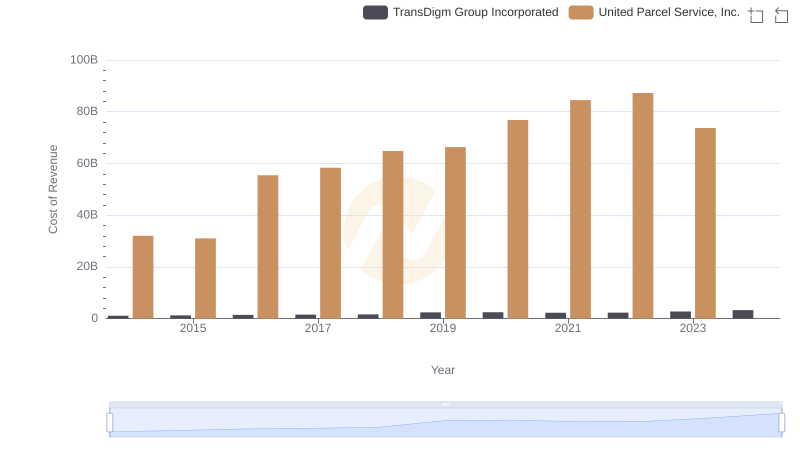
Cost of Revenue: Key Insights for United Parcel Service, Inc. and TransDigm Group Incorporated
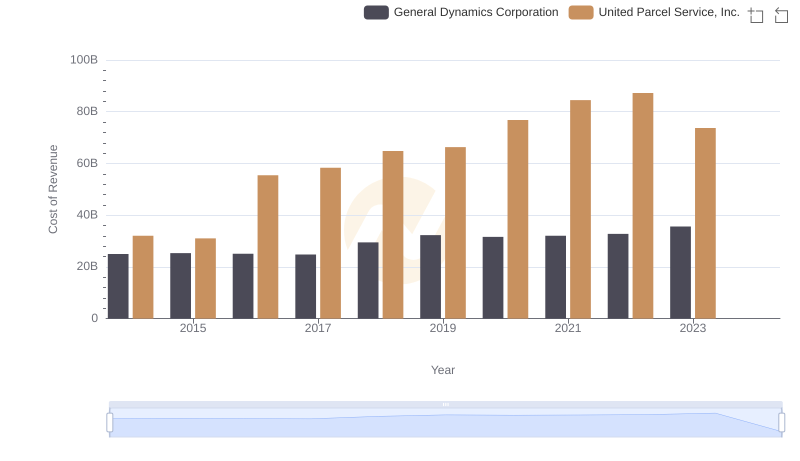
United Parcel Service, Inc. vs General Dynamics Corporation: Efficiency in Cost of Revenue Explored
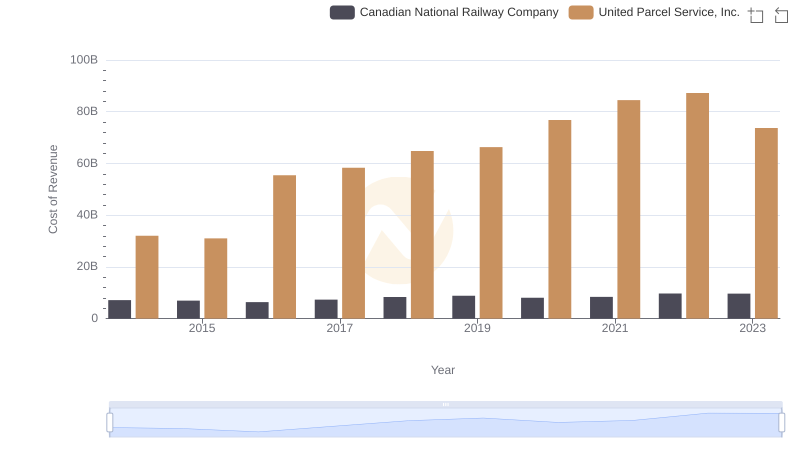
Cost of Revenue Trends: United Parcel Service, Inc. vs Canadian National Railway Company

Cost of Revenue Trends: United Parcel Service, Inc. vs Emerson Electric Co.
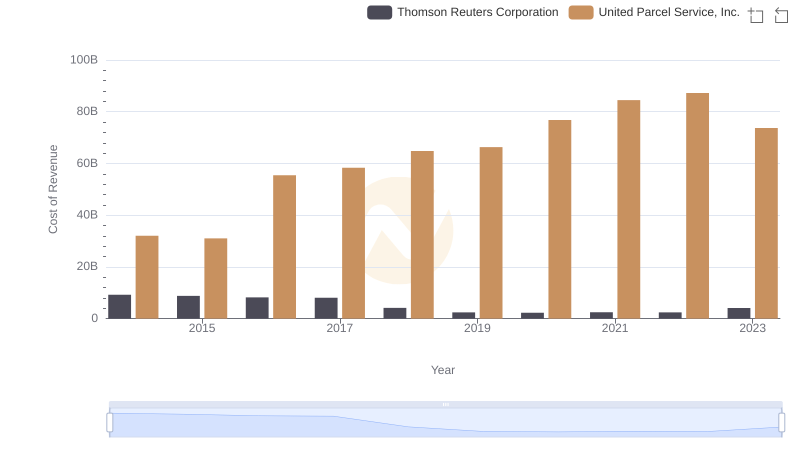
Cost of Revenue: Key Insights for United Parcel Service, Inc. and Thomson Reuters Corporation
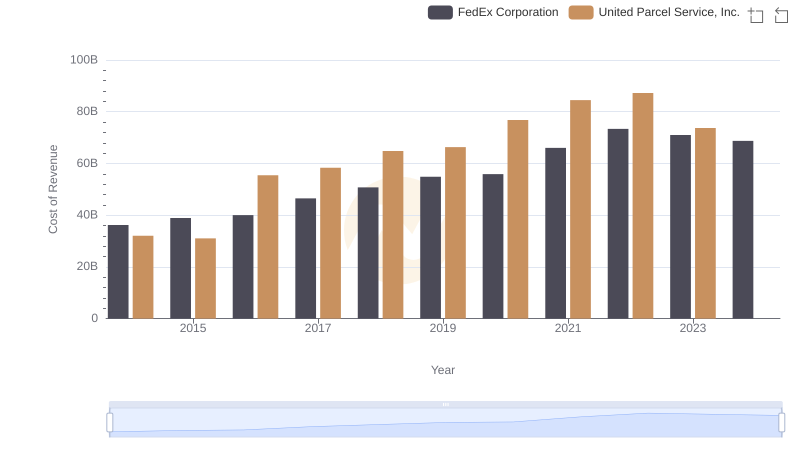
Cost of Revenue Comparison: United Parcel Service, Inc. vs FedEx Corporation
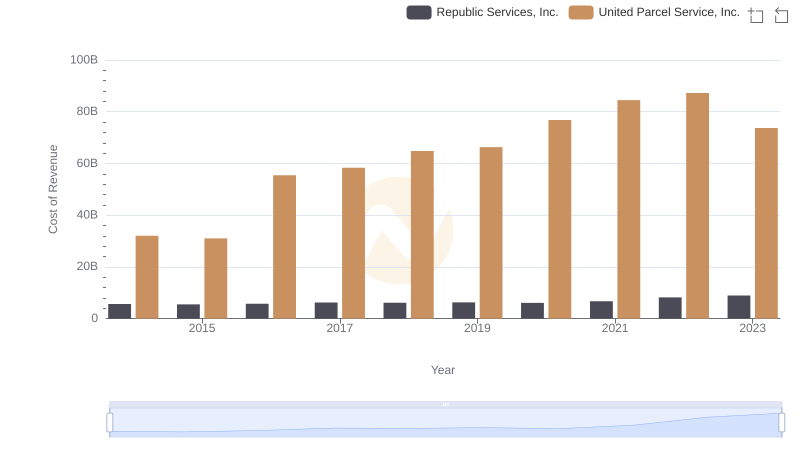
Analyzing Cost of Revenue: United Parcel Service, Inc. and Republic Services, Inc.
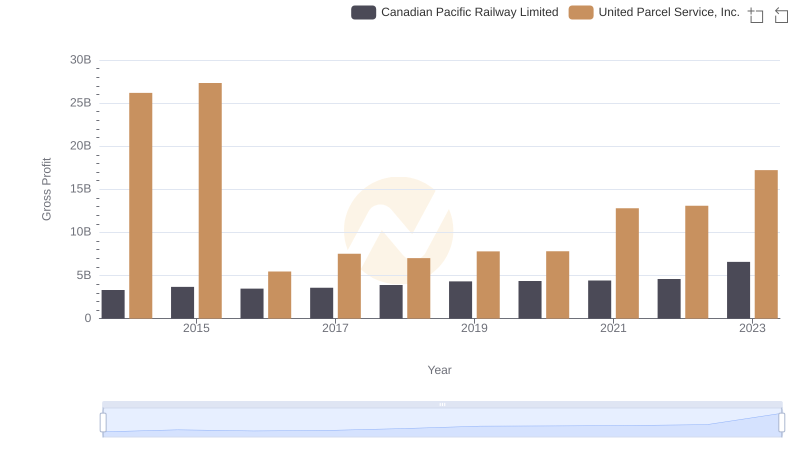
United Parcel Service, Inc. and Canadian Pacific Railway Limited: A Detailed Gross Profit Analysis