| __timestamp | Graco Inc. | Lockheed Martin Corporation |
|---|---|---|
| Wednesday, January 1, 2014 | 554394000 | 40226000000 |
| Thursday, January 1, 2015 | 601785000 | 40830000000 |
| Friday, January 1, 2016 | 621054000 | 42106000000 |
| Sunday, January 1, 2017 | 681695000 | 45500000000 |
| Monday, January 1, 2018 | 770753000 | 46392000000 |
| Tuesday, January 1, 2019 | 786289000 | 51445000000 |
| Wednesday, January 1, 2020 | 795178000 | 56744000000 |
| Friday, January 1, 2021 | 953659000 | 57983000000 |
| Saturday, January 1, 2022 | 1086082000 | 57697000000 |
| Sunday, January 1, 2023 | 1034585000 | 59092000000 |
| Monday, January 1, 2024 | 990855000 | 64113000000 |
Infusing magic into the data realm
In the competitive landscape of aerospace and manufacturing, Lockheed Martin Corporation and Graco Inc. have showcased distinct trajectories in their cost of revenue from 2014 to 2024. Lockheed Martin, a titan in the defense sector, has seen its cost of revenue soar by approximately 60%, reaching a peak in 2024. This growth reflects the company's expanding operations and increased defense contracts. In contrast, Graco Inc., a leader in fluid handling systems, experienced a more modest increase of around 79% over the same period. This steady rise underscores Graco's strategic market expansions and operational efficiencies. Notably, 2021 marked a significant year for both companies, with Graco achieving its highest annual growth rate, while Lockheed Martin maintained its upward momentum. These trends highlight the dynamic nature of cost management in different industries, offering valuable insights for investors and industry analysts alike.
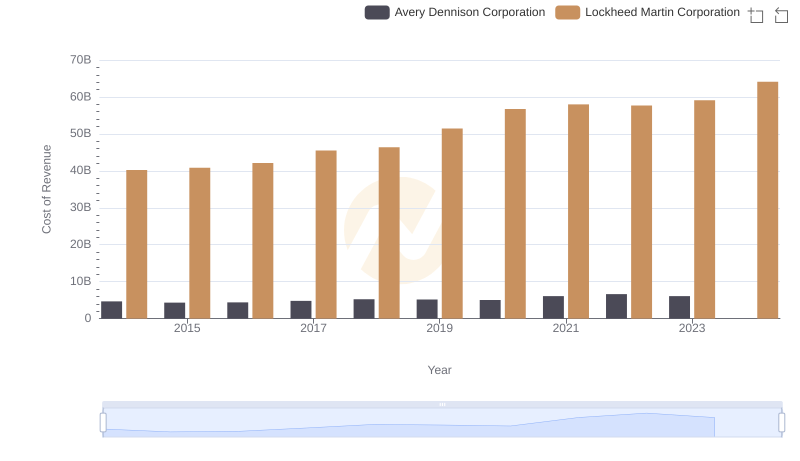
Cost of Revenue: Key Insights for Lockheed Martin Corporation and Avery Dennison Corporation
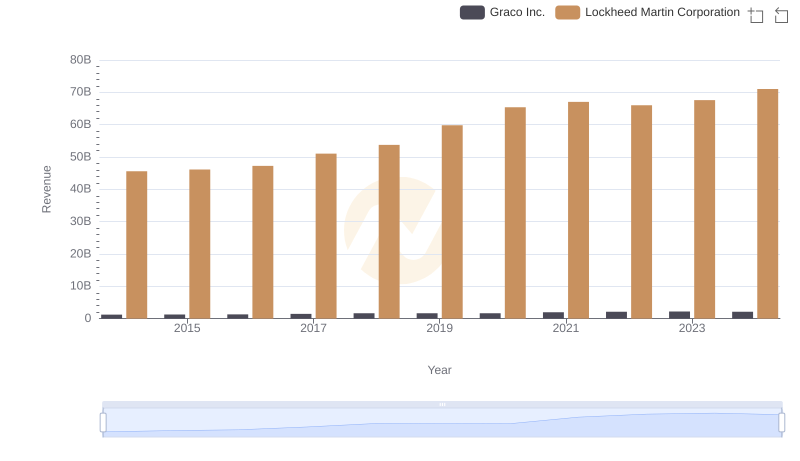
Annual Revenue Comparison: Lockheed Martin Corporation vs Graco Inc.
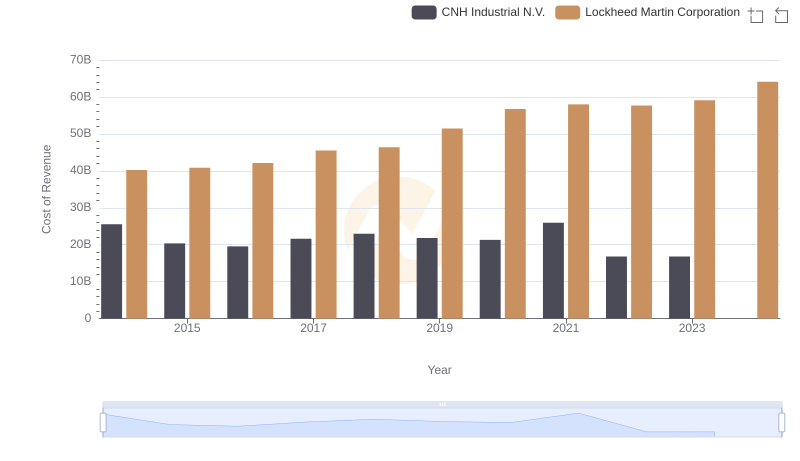
Cost Insights: Breaking Down Lockheed Martin Corporation and CNH Industrial N.V.'s Expenses

Cost of Revenue: Key Insights for Lockheed Martin Corporation and Comfort Systems USA, Inc.
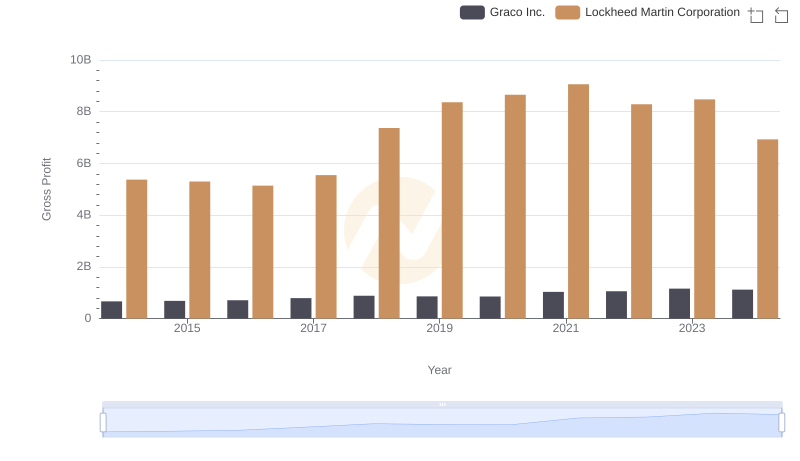
Lockheed Martin Corporation vs Graco Inc.: A Gross Profit Performance Breakdown
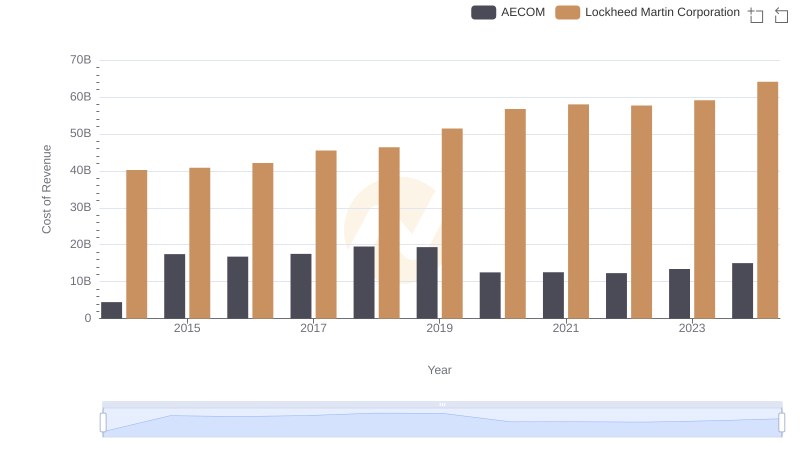
Cost of Revenue: Key Insights for Lockheed Martin Corporation and AECOM

Cost of Revenue Trends: Lockheed Martin Corporation vs Pool Corporation
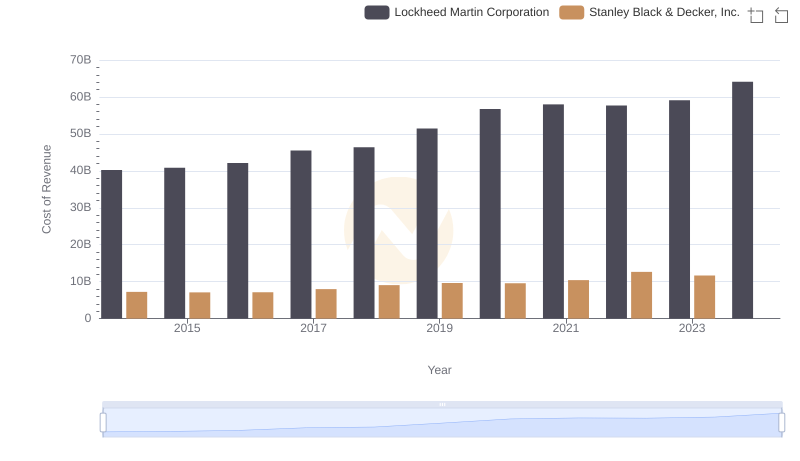
Cost Insights: Breaking Down Lockheed Martin Corporation and Stanley Black & Decker, Inc.'s Expenses
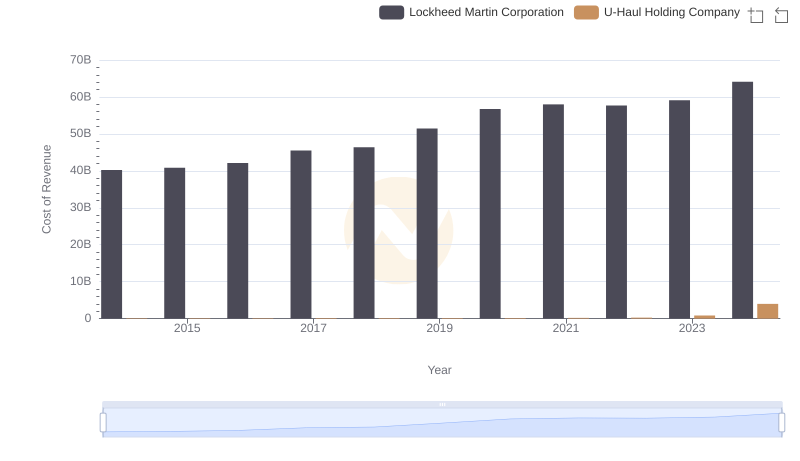
Cost of Revenue Trends: Lockheed Martin Corporation vs U-Haul Holding Company
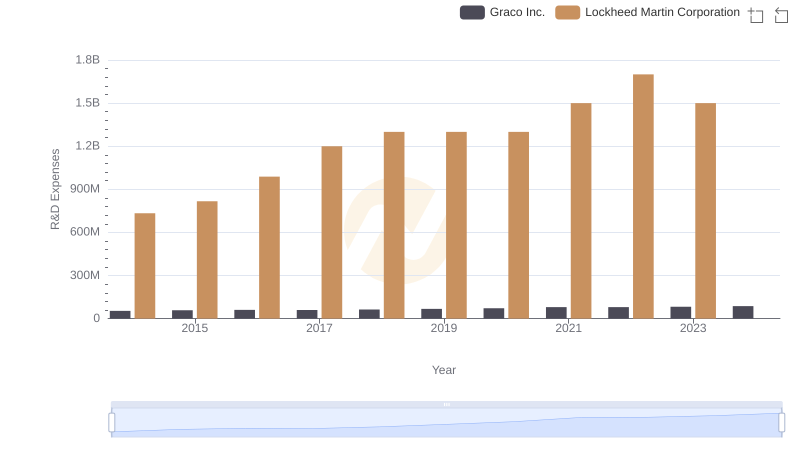
Lockheed Martin Corporation vs Graco Inc.: Strategic Focus on R&D Spending
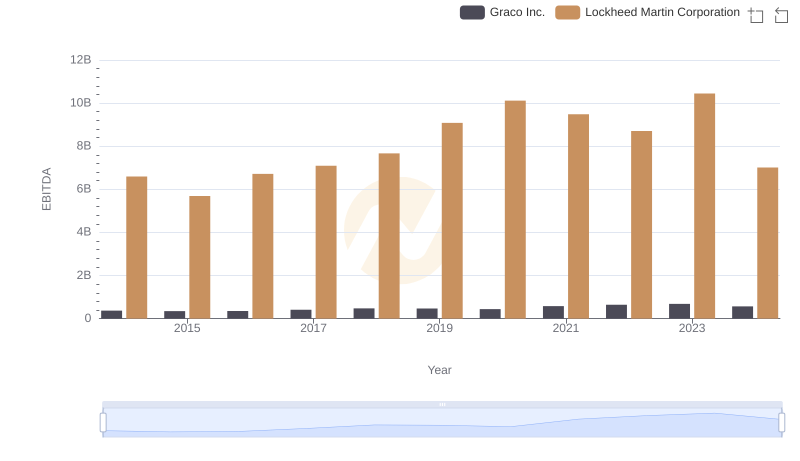
A Professional Review of EBITDA: Lockheed Martin Corporation Compared to Graco Inc.