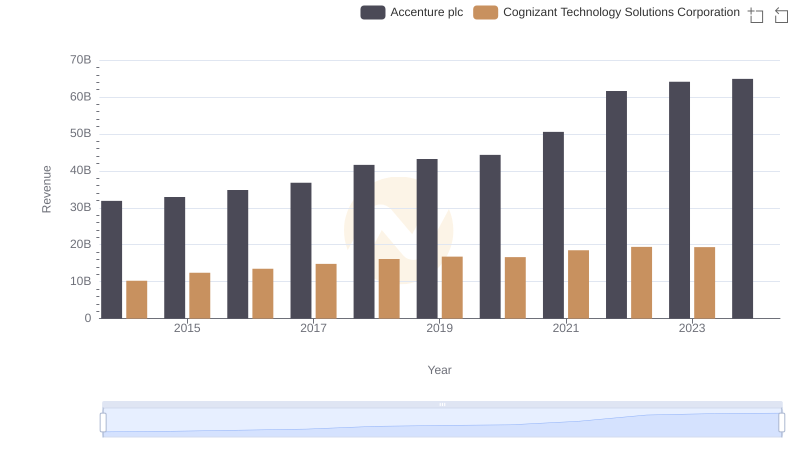
| __timestamp | Accenture plc | Cognizant Technology Solutions Corporation |
|---|---|---|
| Wednesday, January 1, 2014 | 22190212000 | 6141118000 |
| Thursday, January 1, 2015 | 23105185000 | 7440200000 |
| Friday, January 1, 2016 | 24520234000 | 8108000000 |
| Sunday, January 1, 2017 | 25734986000 | 9152000000 |
| Monday, January 1, 2018 | 29160515000 | 9838000000 |
| Tuesday, January 1, 2019 | 29900325000 | 10634000000 |
| Wednesday, January 1, 2020 | 30350881000 | 10671000000 |
| Friday, January 1, 2021 | 34169261000 | 11604000000 |
| Saturday, January 1, 2022 | 41892766000 | 12448000000 |
| Sunday, January 1, 2023 | 43380138000 | 12664000000 |
| Monday, January 1, 2024 | 43734147000 | 12958000000 |
In pursuit of knowledge
In the ever-evolving landscape of global technology services, understanding cost structures is pivotal. Accenture plc and Cognizant Technology Solutions Corporation, two giants in the industry, have shown intriguing trends in their cost of revenue over the past decade. From 2014 to 2023, Accenture's cost of revenue surged by nearly 97%, reflecting its expansive growth and strategic investments. In contrast, Cognizant's costs increased by approximately 106%, indicating a robust expansion strategy.
These insights reveal the strategic maneuvers of these tech titans, offering a glimpse into their operational efficiencies and market strategies.
Accenture plc vs Cognizant Technology Solutions Corporation: Examining Key Revenue Metrics

Accenture plc vs Gartner, Inc.: Efficiency in Cost of Revenue Explored
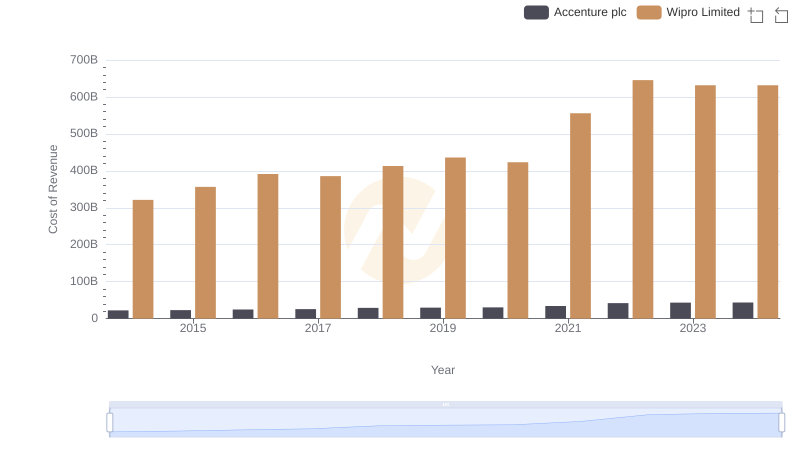
Cost Insights: Breaking Down Accenture plc and Wipro Limited's Expenses
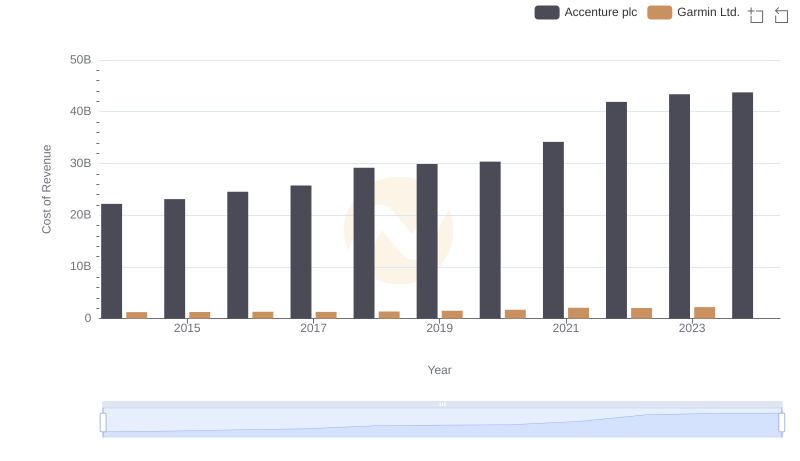
Cost of Revenue Comparison: Accenture plc vs Garmin Ltd.
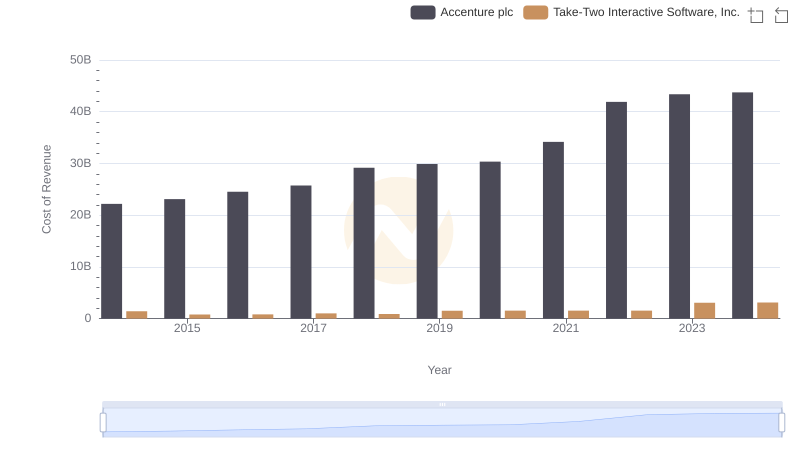
Cost of Revenue: Key Insights for Accenture plc and Take-Two Interactive Software, Inc.
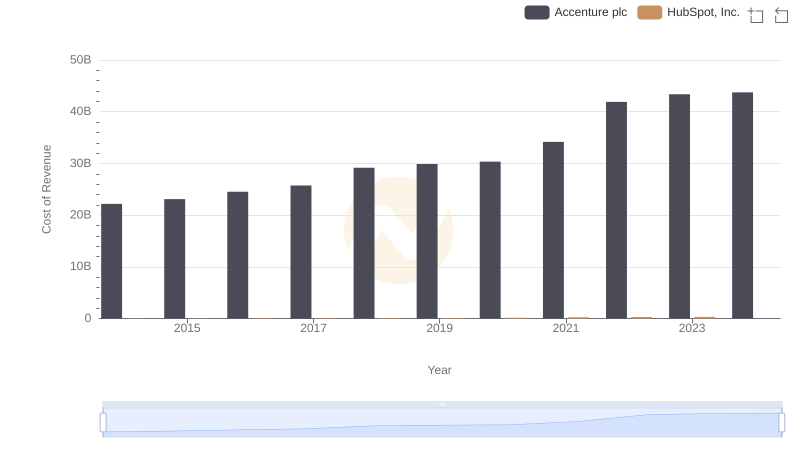
Cost Insights: Breaking Down Accenture plc and HubSpot, Inc.'s Expenses
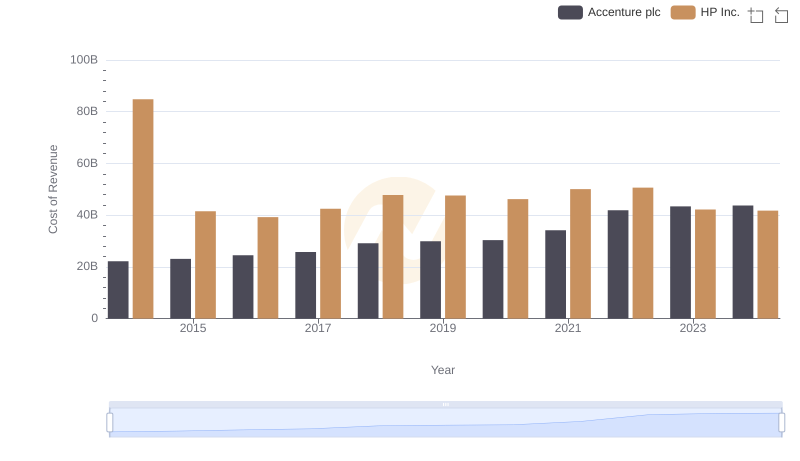
Cost of Revenue Trends: Accenture plc vs HP Inc.
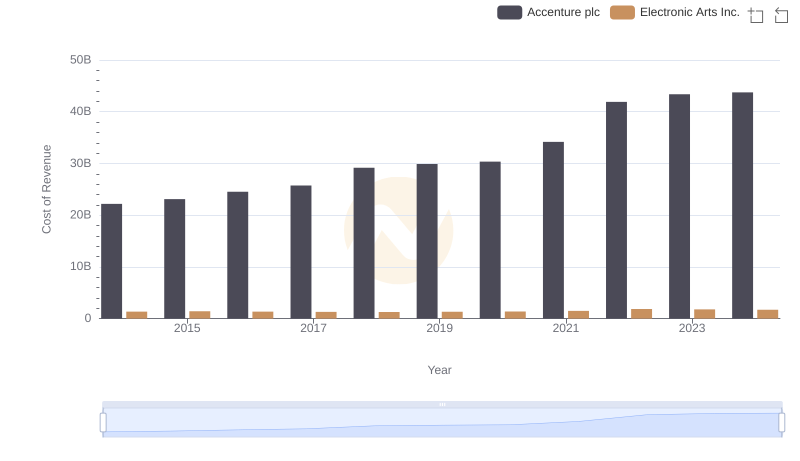
Cost Insights: Breaking Down Accenture plc and Electronic Arts Inc.'s Expenses

Comparing Cost of Revenue Efficiency: Accenture plc vs Microchip Technology Incorporated
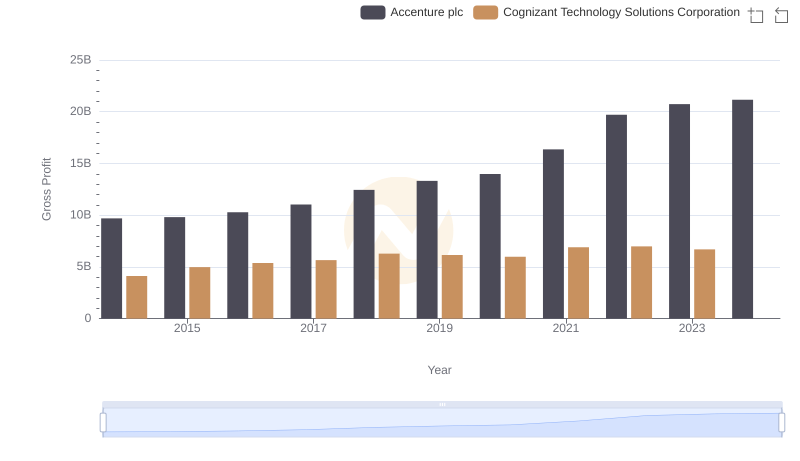
Accenture plc and Cognizant Technology Solutions Corporation: A Detailed Gross Profit Analysis
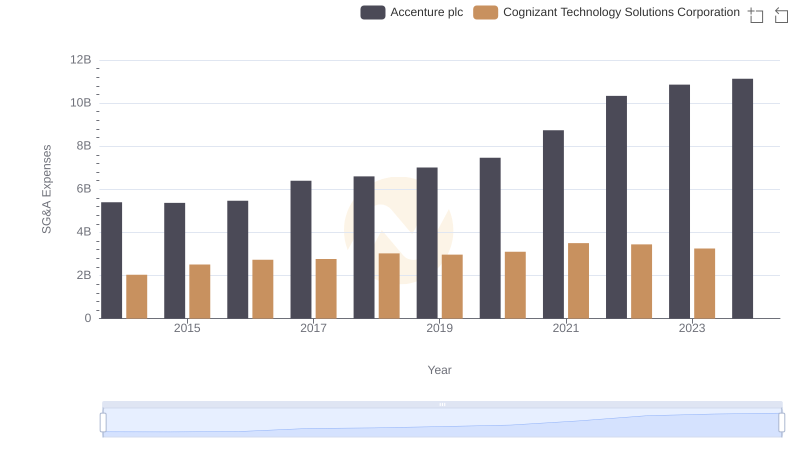
Accenture plc or Cognizant Technology Solutions Corporation: Who Manages SG&A Costs Better?
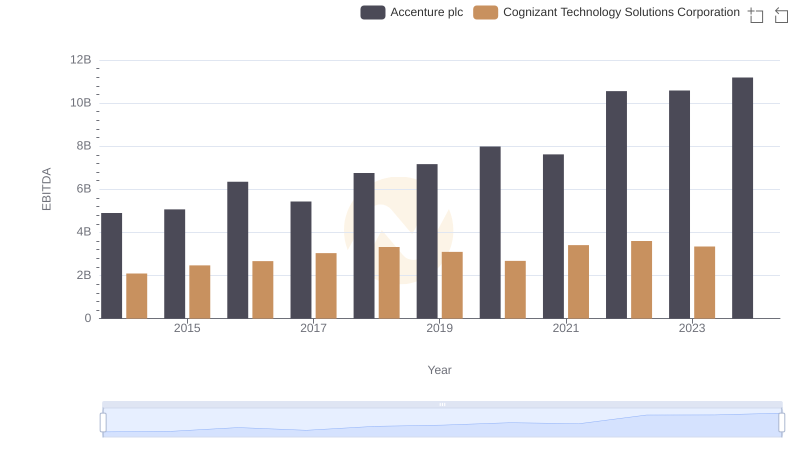
Accenture plc vs Cognizant Technology Solutions Corporation: In-Depth EBITDA Performance Comparison