| __timestamp | Gen Digital Inc. | Teledyne Technologies Incorporated |
|---|---|---|
| Wednesday, January 1, 2014 | 1149000000 | 1487100000 |
| Thursday, January 1, 2015 | 1153000000 | 1427800000 |
| Friday, January 1, 2016 | 615000000 | 1308800000 |
| Sunday, January 1, 2017 | 853000000 | 1612200000 |
| Monday, January 1, 2018 | 1032000000 | 1791000000 |
| Tuesday, January 1, 2019 | 1050000000 | 1920300000 |
| Wednesday, January 1, 2020 | 393000000 | 1905300000 |
| Friday, January 1, 2021 | 362000000 | 2772900000 |
| Saturday, January 1, 2022 | 408000000 | 3128300000 |
| Sunday, January 1, 2023 | 589000000 | 3196100000 |
| Monday, January 1, 2024 | 731000000 |
Igniting the spark of knowledge
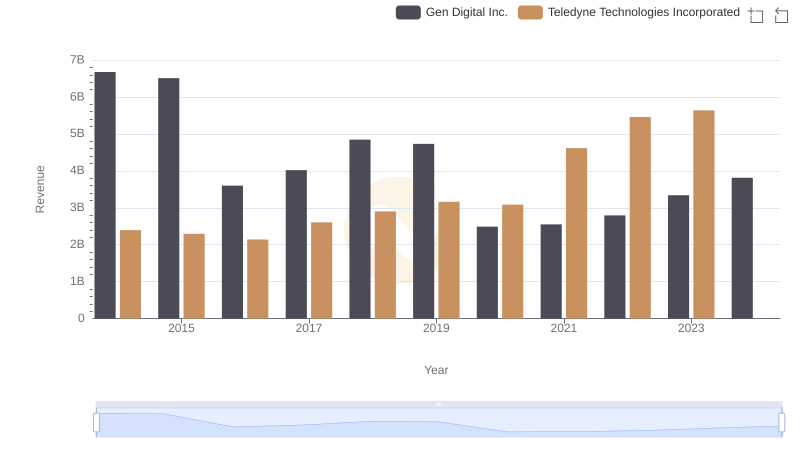
In the ever-evolving landscape of technology, understanding the cost of revenue is crucial for evaluating a company's financial health. This chart provides a fascinating comparison between Teledyne Technologies Incorporated and Gen Digital Inc. over the past decade. From 2014 to 2023, Teledyne consistently outpaced Gen Digital in cost of revenue, peaking in 2023 with a staggering 3.2 billion, a 115% increase from 2014. Meanwhile, Gen Digital's cost of revenue saw a significant decline, dropping by 68% from its 2015 peak to 2021, before rebounding slightly in 2024. This divergence highlights Teledyne's robust growth strategy and operational efficiency, while Gen Digital's fluctuating figures suggest a period of restructuring or strategic pivot. Missing data for Teledyne in 2024 suggests a potential shift or anomaly worth investigating further. This analysis underscores the importance of cost management in sustaining competitive advantage.
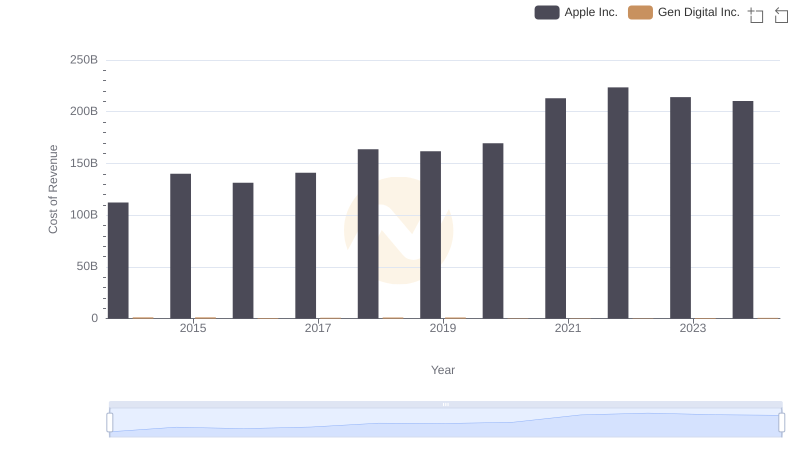
Analyzing Cost of Revenue: Apple Inc. and Gen Digital Inc.
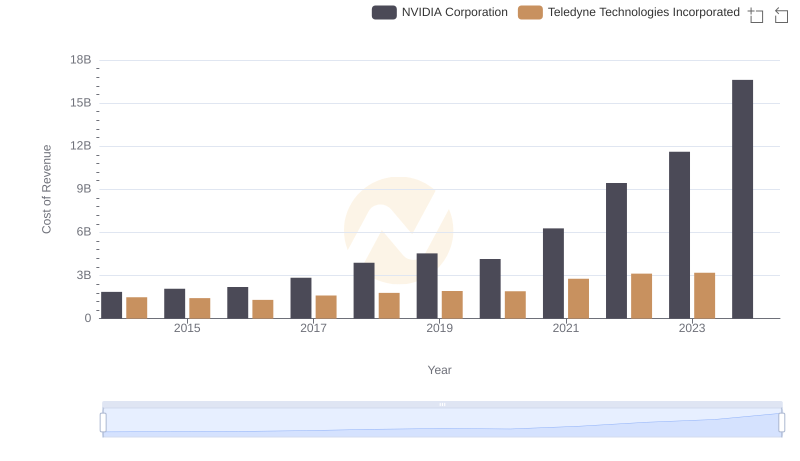
Cost of Revenue Comparison: NVIDIA Corporation vs Teledyne Technologies Incorporated
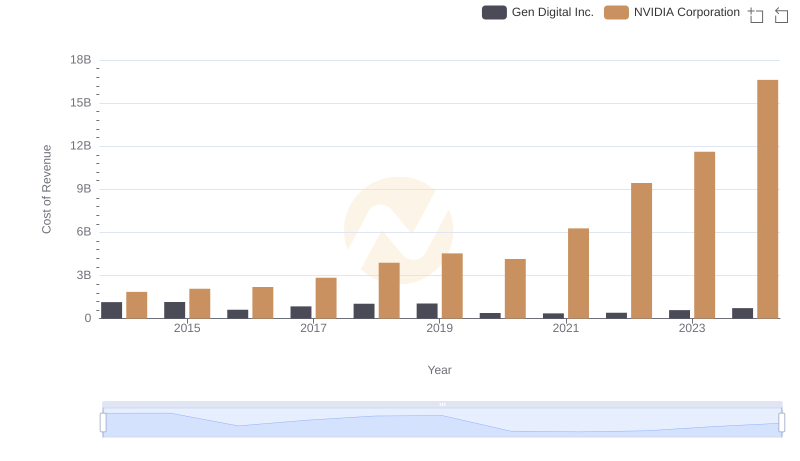
Cost Insights: Breaking Down NVIDIA Corporation and Gen Digital Inc.'s Expenses
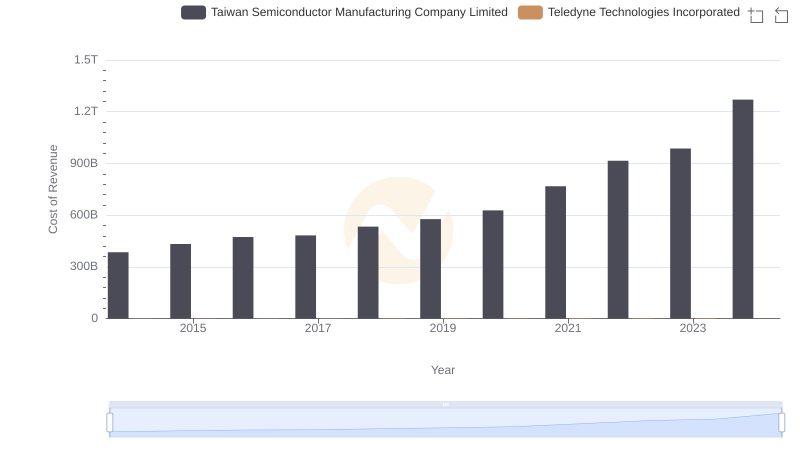
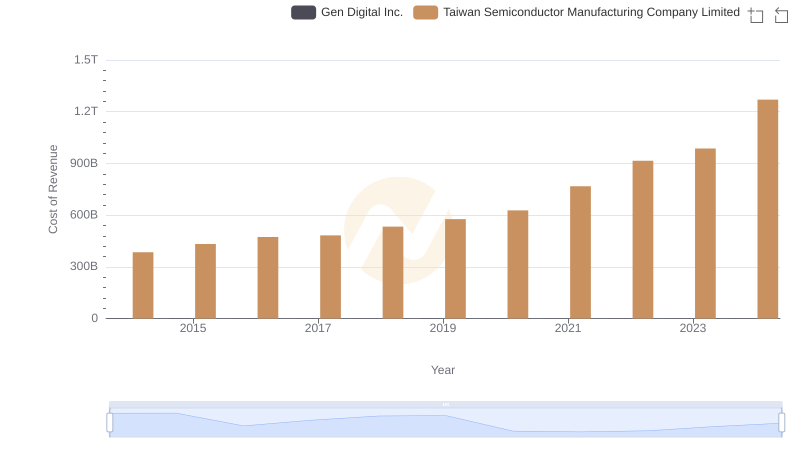
Analyzing Cost of Revenue: Taiwan Semiconductor Manufacturing Company Limited and Teledyne Technologies Incorporated
Cost of Revenue Trends: Taiwan Semiconductor Manufacturing Company Limited vs Gen Digital Inc.
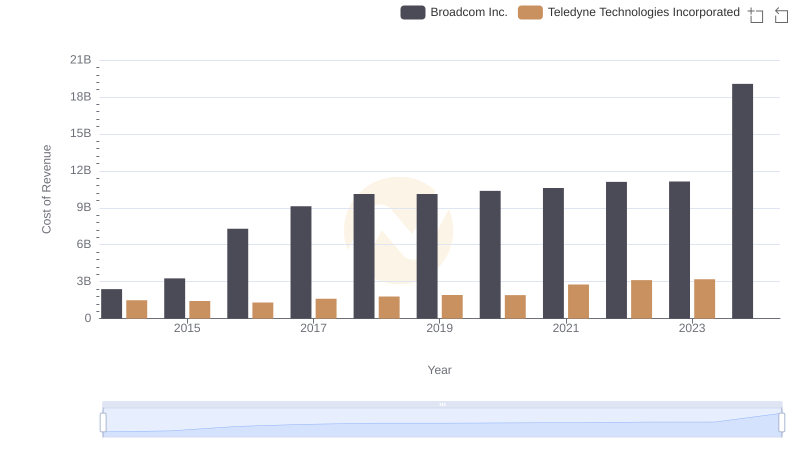
Broadcom Inc. vs Teledyne Technologies Incorporated: Efficiency in Cost of Revenue Explored
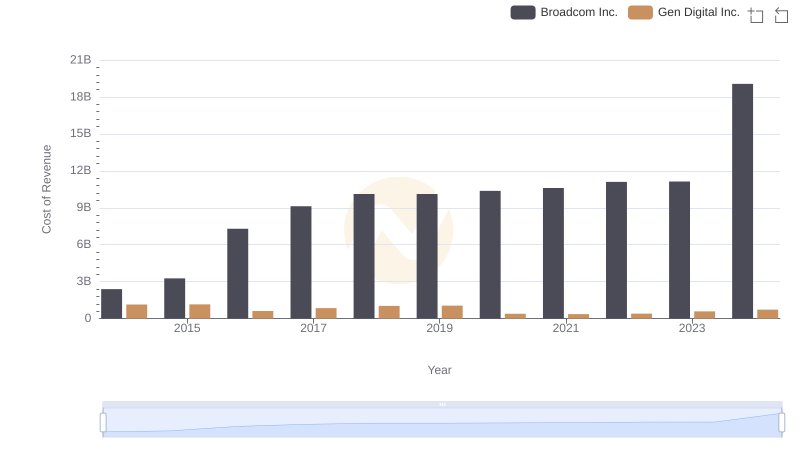
Comparing Cost of Revenue Efficiency: Broadcom Inc. vs Gen Digital Inc.
Revenue Showdown: Teledyne Technologies Incorporated vs Gen Digital Inc.
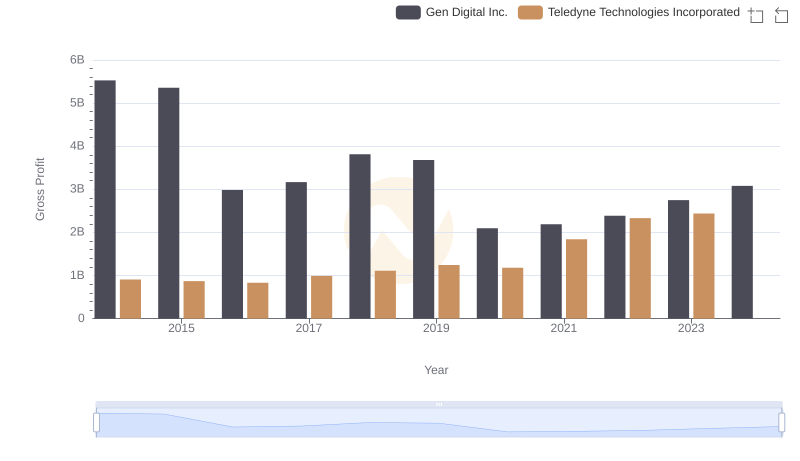
Key Insights on Gross Profit: Teledyne Technologies Incorporated vs Gen Digital Inc.
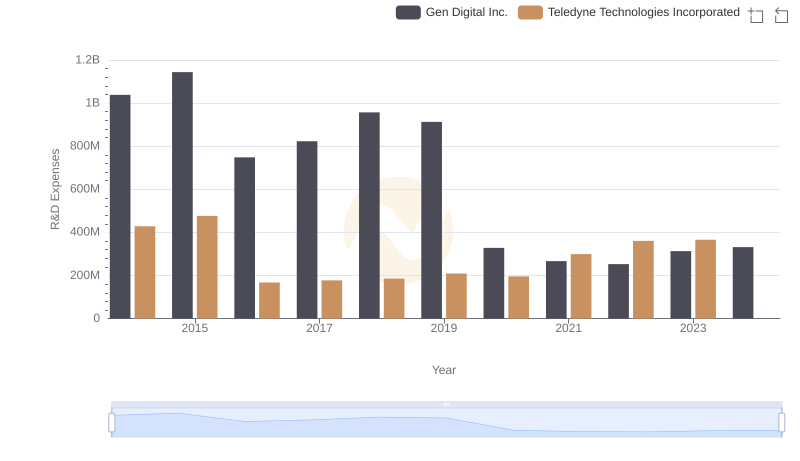
Comparing Innovation Spending: Teledyne Technologies Incorporated and Gen Digital Inc.
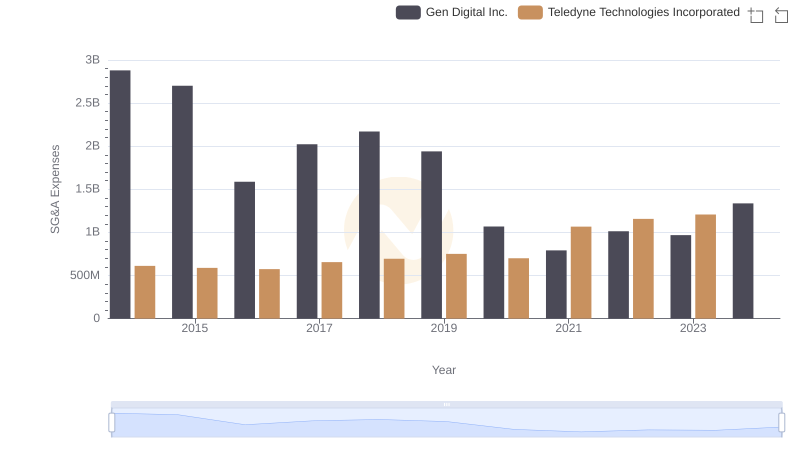
Teledyne Technologies Incorporated or Gen Digital Inc.: Who Manages SG&A Costs Better?
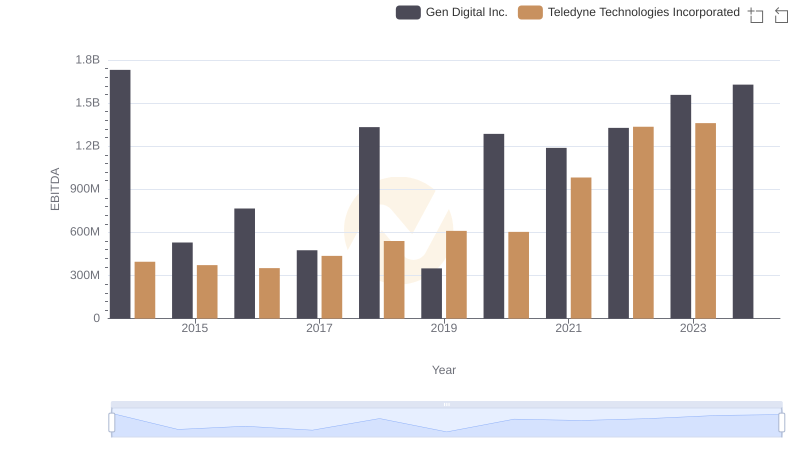
A Professional Review of EBITDA: Teledyne Technologies Incorporated Compared to Gen Digital Inc.