| __timestamp | TFI International Inc. | TransUnion |
|---|---|---|
| Wednesday, January 1, 2014 | 2782605137 | 499100000 |
| Thursday, January 1, 2015 | 2551474032 | 531600000 |
| Friday, January 1, 2016 | 2636493564 | 579100000 |
| Sunday, January 1, 2017 | 3364979721 | 645700000 |
| Monday, January 1, 2018 | 3251443800 | 790100000 |
| Tuesday, January 1, 2019 | 3461987950 | 874100000 |
| Wednesday, January 1, 2020 | 3239249000 | 920400000 |
| Friday, January 1, 2021 | 6182566000 | 991600000 |
| Saturday, January 1, 2022 | 7385640000 | 1222900000 |
| Sunday, January 1, 2023 | 6255775000 | 1517300000 |
| Monday, January 1, 2024 | 0 |
Cracking the code
In the ever-evolving landscape of corporate efficiency, the cost of revenue is a critical metric. Over the past decade, TFI International Inc. and TransUnion have showcased contrasting trajectories in this domain. From 2014 to 2023, TFI International Inc. has seen its cost of revenue soar by approximately 125%, peaking in 2022. This growth reflects its aggressive expansion and operational scaling. In contrast, TransUnion's cost of revenue has increased by about 200% over the same period, indicating a steady yet significant rise in operational expenses.
While TFI International Inc. experienced a dramatic spike in 2021, TransUnion's growth has been more consistent, with a notable increase in 2023. These trends highlight the diverse strategies and market conditions influencing each company's financial efficiency. As we delve deeper into these figures, the narrative of strategic growth and operational challenges becomes evident.

Comparing Cost of Revenue Efficiency: TransUnion vs Curtiss-Wright Corporation
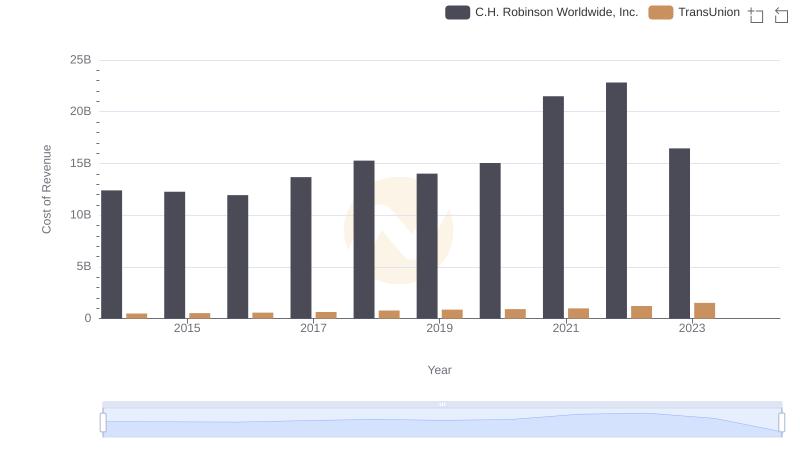
Cost of Revenue Trends: TransUnion vs C.H. Robinson Worldwide, Inc.

Comparing Cost of Revenue Efficiency: TransUnion vs Nordson Corporation
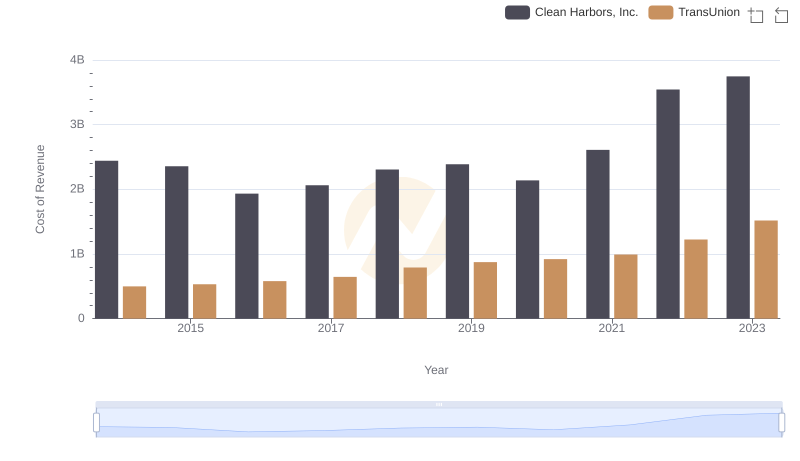
Comparing Cost of Revenue Efficiency: TransUnion vs Clean Harbors, Inc.
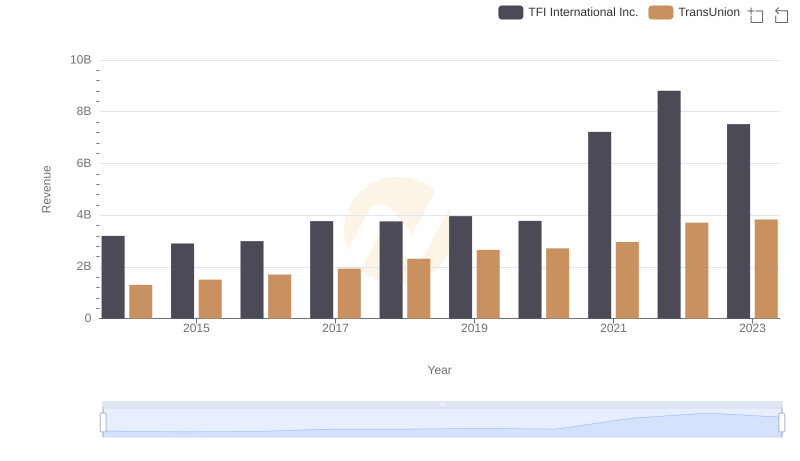
Who Generates More Revenue? TransUnion or TFI International Inc.
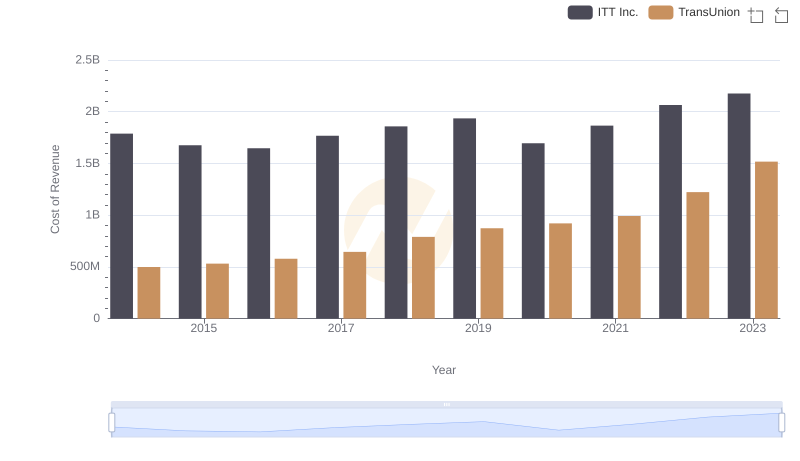
Cost Insights: Breaking Down TransUnion and ITT Inc.'s Expenses
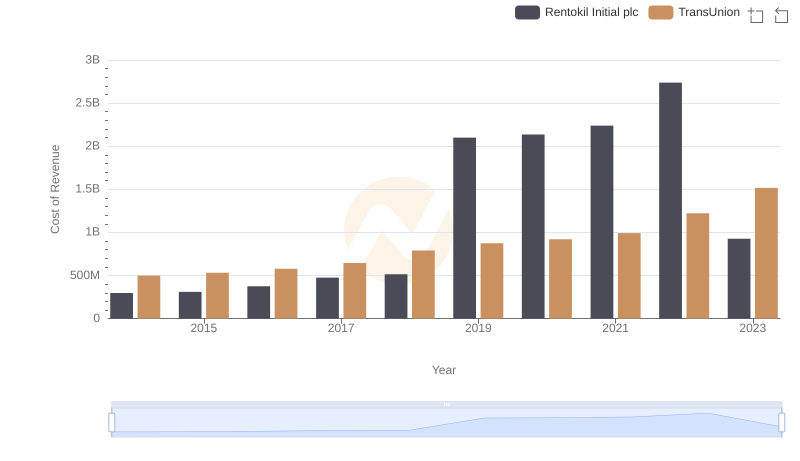
TransUnion vs Rentokil Initial plc: Efficiency in Cost of Revenue Explored
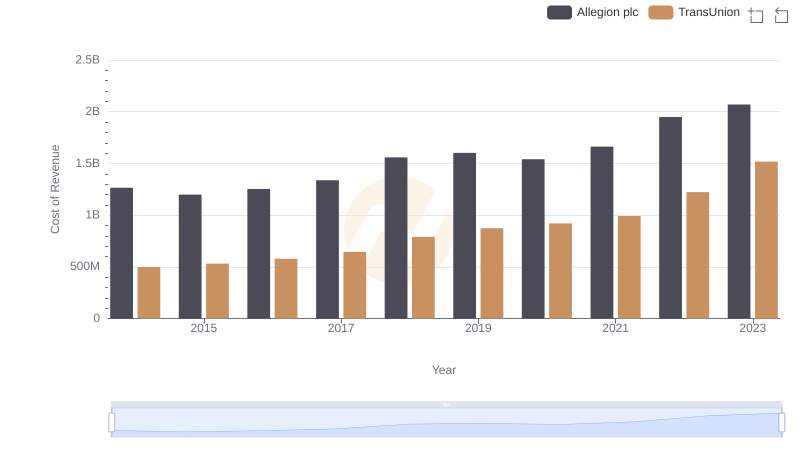
Cost Insights: Breaking Down TransUnion and Allegion plc's Expenses
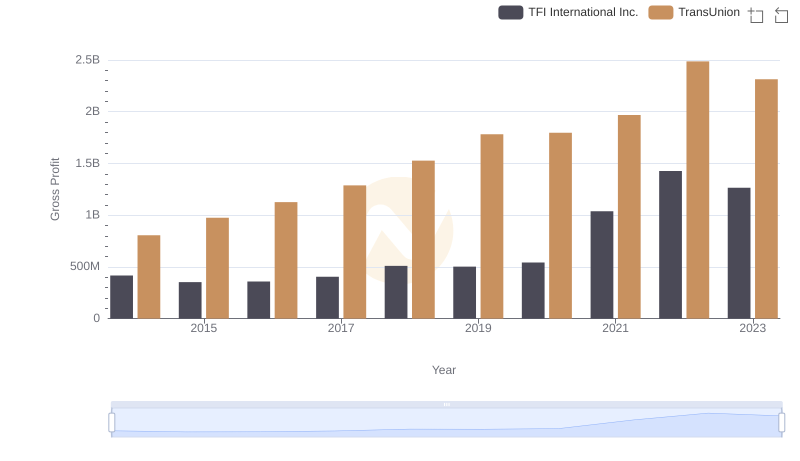
Gross Profit Trends Compared: TransUnion vs TFI International Inc.
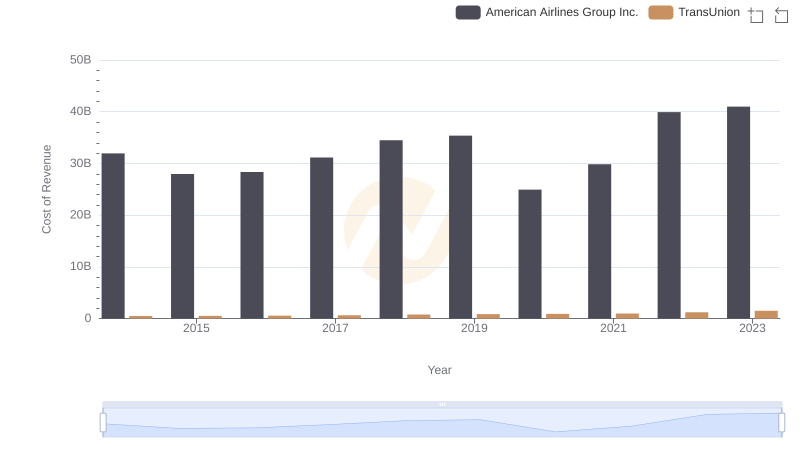
Cost Insights: Breaking Down TransUnion and American Airlines Group Inc.'s Expenses