| __timestamp | Clean Harbors, Inc. | TransUnion |
|---|---|---|
| Wednesday, January 1, 2014 | 2441796000 | 499100000 |
| Thursday, January 1, 2015 | 2356806000 | 531600000 |
| Friday, January 1, 2016 | 1932857000 | 579100000 |
| Sunday, January 1, 2017 | 2062673000 | 645700000 |
| Monday, January 1, 2018 | 2305551000 | 790100000 |
| Tuesday, January 1, 2019 | 2387819000 | 874100000 |
| Wednesday, January 1, 2020 | 2137751000 | 920400000 |
| Friday, January 1, 2021 | 2609837000 | 991600000 |
| Saturday, January 1, 2022 | 3543930000 | 1222900000 |
| Sunday, January 1, 2023 | 3746124000 | 1517300000 |
| Monday, January 1, 2024 | 4065713000 | 0 |
Unleashing insights
In the ever-evolving landscape of corporate finance, understanding cost efficiency is paramount. Over the past decade, Clean Harbors, Inc. and TransUnion have showcased distinct trajectories in managing their cost of revenue. Clean Harbors, Inc. has consistently maintained a higher cost of revenue, peaking at approximately 3.75 billion in 2023, reflecting a 54% increase since 2014. In contrast, TransUnion's cost of revenue has grown more modestly, reaching around 1.52 billion in 2023, marking a 204% rise from its 2014 figures. This stark difference highlights Clean Harbors' expansive operational scale compared to TransUnion's more streamlined approach. As businesses navigate the complexities of cost management, these insights offer a valuable lens into strategic financial planning. The data underscores the importance of balancing growth with cost efficiency, a lesson for companies aiming to thrive in competitive markets.
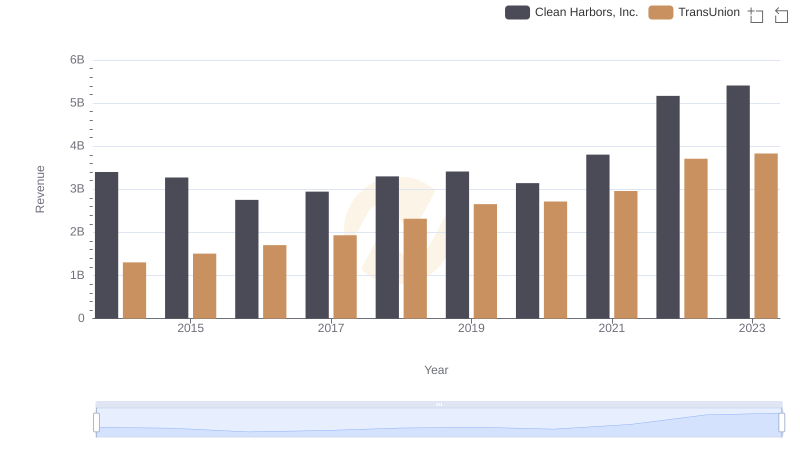
Revenue Insights: TransUnion and Clean Harbors, Inc. Performance Compared
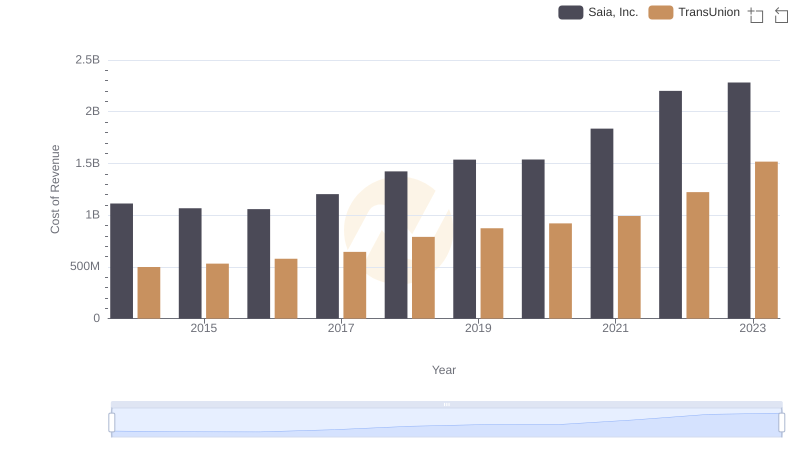
Comparing Cost of Revenue Efficiency: TransUnion vs Saia, Inc.
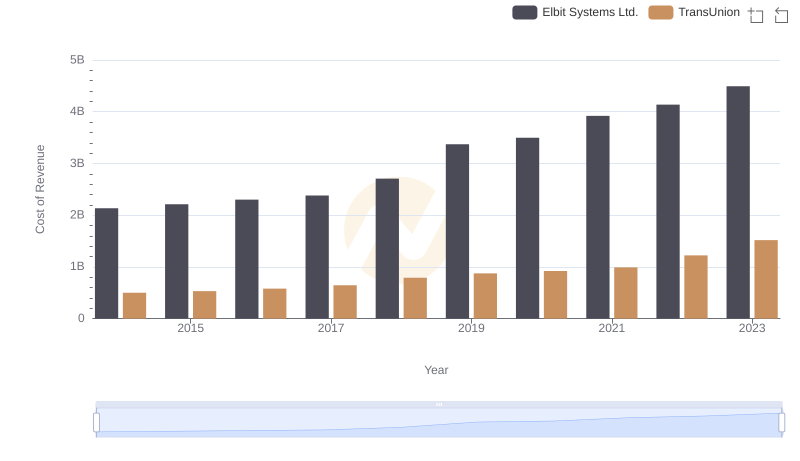
Cost Insights: Breaking Down TransUnion and Elbit Systems Ltd.'s Expenses

Comparing Cost of Revenue Efficiency: TransUnion vs Curtiss-Wright Corporation
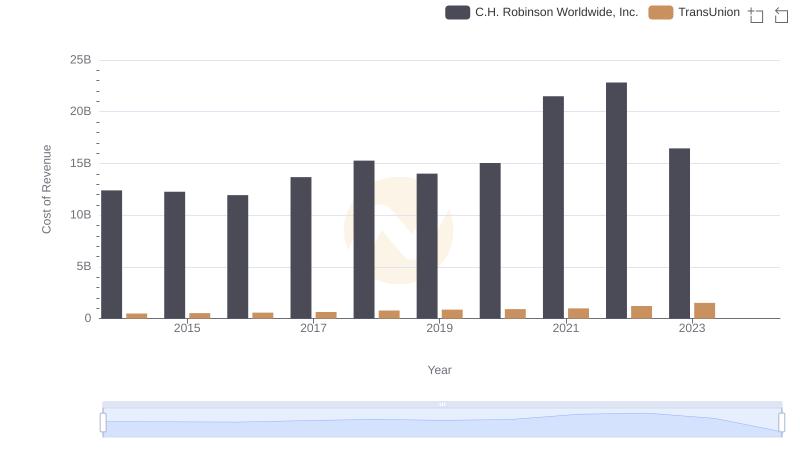
Cost of Revenue Trends: TransUnion vs C.H. Robinson Worldwide, Inc.

Comparing Cost of Revenue Efficiency: TransUnion vs Nordson Corporation
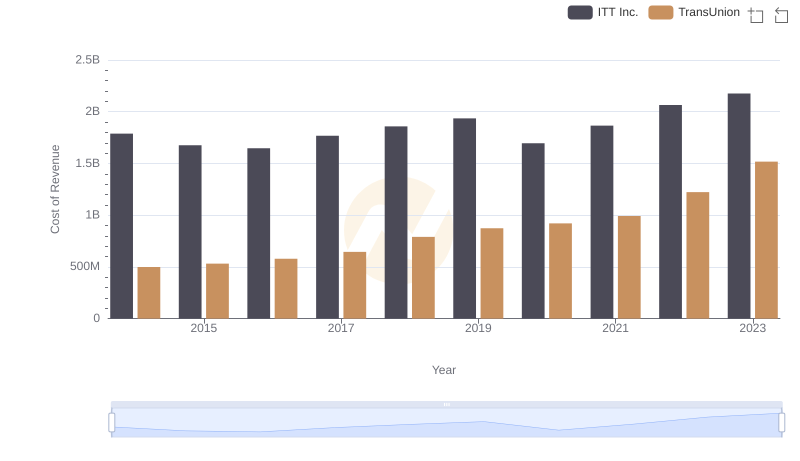
Cost Insights: Breaking Down TransUnion and ITT Inc.'s Expenses
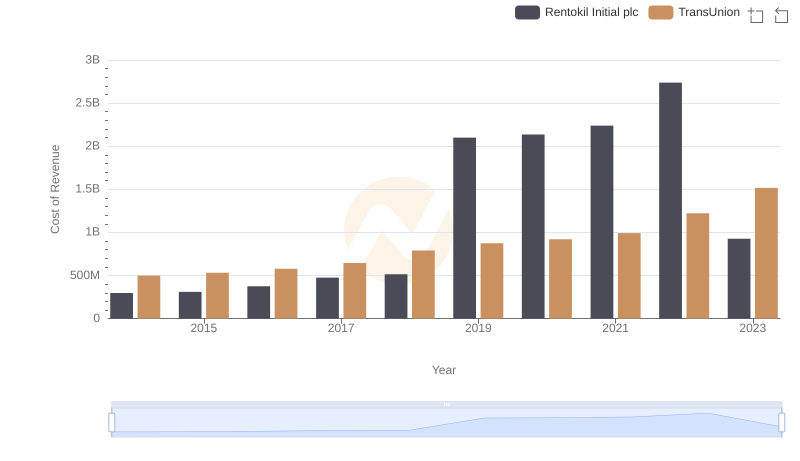
TransUnion vs Rentokil Initial plc: Efficiency in Cost of Revenue Explored
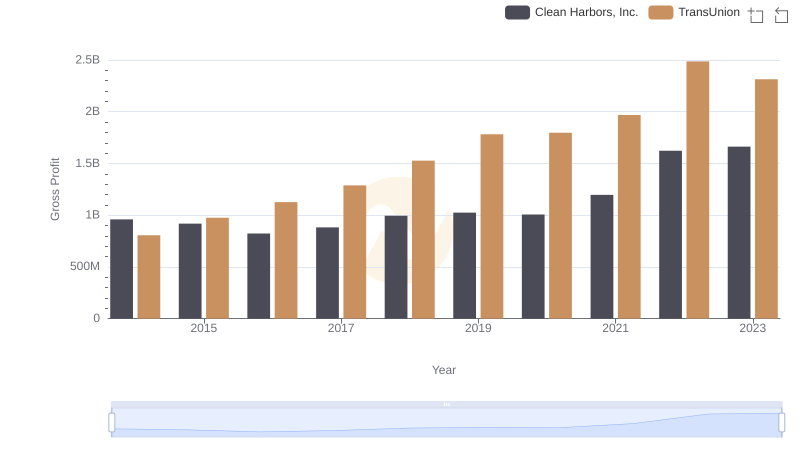
Gross Profit Trends Compared: TransUnion vs Clean Harbors, Inc.
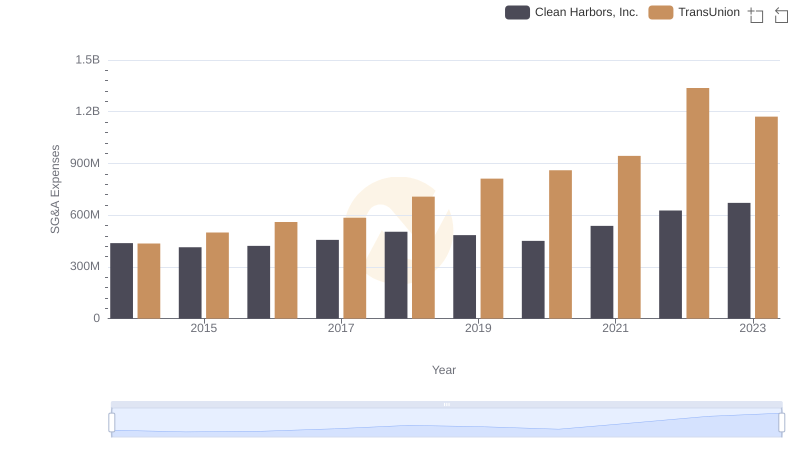
Selling, General, and Administrative Costs: TransUnion vs Clean Harbors, Inc.
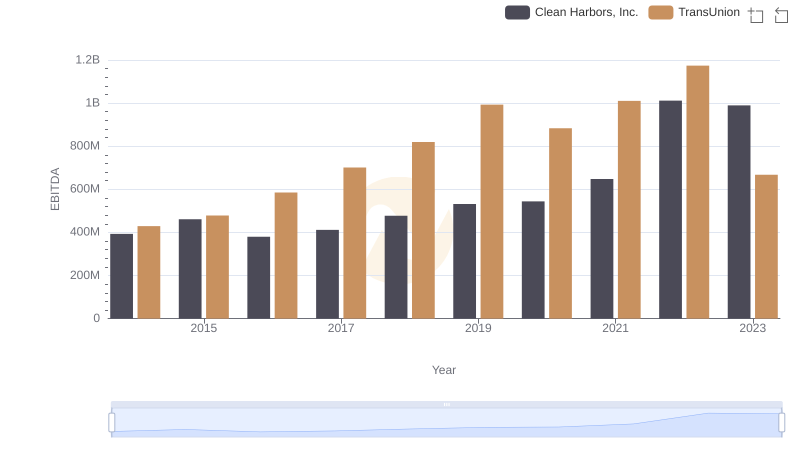
Comparative EBITDA Analysis: TransUnion vs Clean Harbors, Inc.