| __timestamp | Allegion plc | Snap-on Incorporated |
|---|---|---|
| Wednesday, January 1, 2014 | 1264600000 | 1693400000 |
| Thursday, January 1, 2015 | 1199000000 | 1704500000 |
| Friday, January 1, 2016 | 1252700000 | 1720800000 |
| Sunday, January 1, 2017 | 1337500000 | 1862000000 |
| Monday, January 1, 2018 | 1558400000 | 1870700000 |
| Tuesday, January 1, 2019 | 1601700000 | 1886000000 |
| Wednesday, January 1, 2020 | 1541100000 | 1844000000 |
| Friday, January 1, 2021 | 1662500000 | 2141200000 |
| Saturday, January 1, 2022 | 1949500000 | 2311700000 |
| Sunday, January 1, 2023 | 2069300000 | 2488500000 |
| Monday, January 1, 2024 | 2103700000 | 2329500000 |
In pursuit of knowledge
In the ever-evolving landscape of industrial manufacturing, understanding cost efficiency is paramount. Over the past decade, Snap-on Incorporated and Allegion plc have demonstrated distinct trajectories in their cost of revenue efficiency. From 2014 to 2023, Snap-on consistently maintained a higher cost of revenue, peaking at approximately 2.49 billion in 2023, a 47% increase from 2014. Allegion, while starting lower, showed a remarkable 64% growth, reaching around 2.07 billion in the same year.
This trend highlights Snap-on's robust market presence and operational scale, while Allegion's growth underscores its strategic advancements in cost management. As we delve into these figures, it becomes evident that both companies have navigated the complexities of the market with distinct strategies, offering valuable lessons in efficiency and growth.
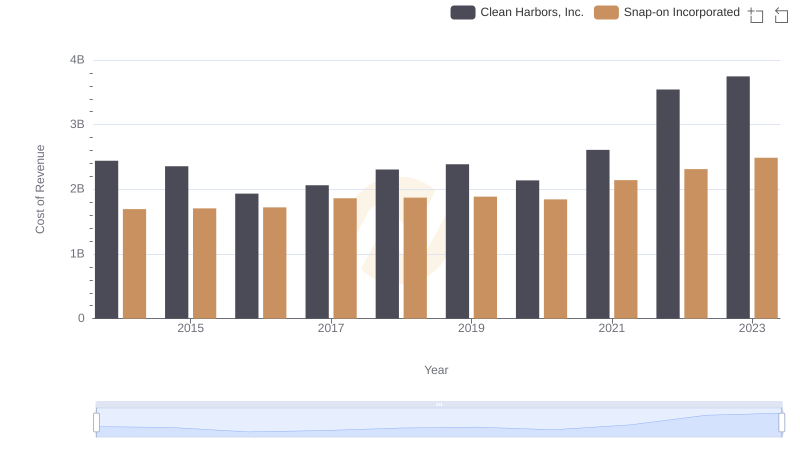
Comparing Cost of Revenue Efficiency: Snap-on Incorporated vs Clean Harbors, Inc.

Cost of Revenue Comparison: Snap-on Incorporated vs C.H. Robinson Worldwide, Inc.
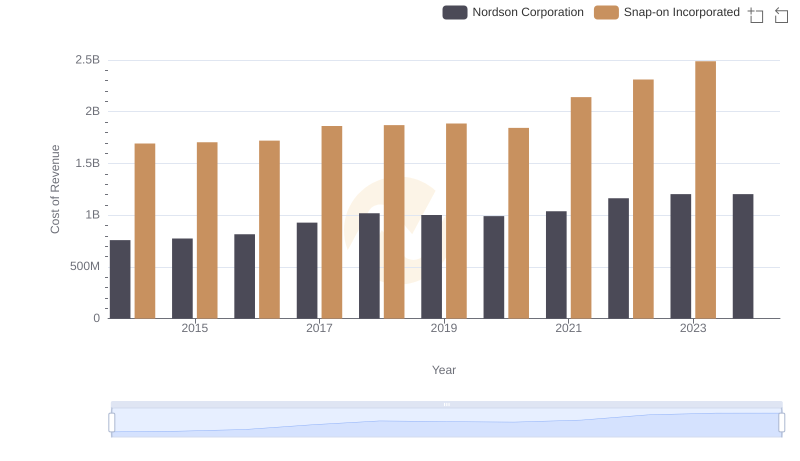
Comparing Cost of Revenue Efficiency: Snap-on Incorporated vs Nordson Corporation
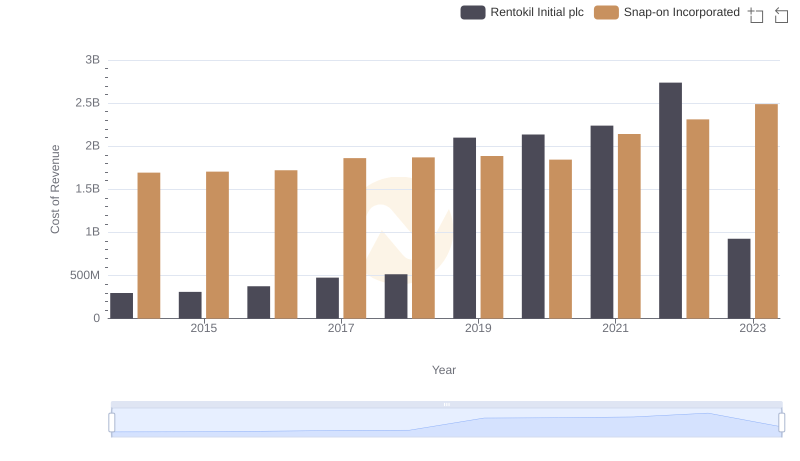
Cost of Revenue Comparison: Snap-on Incorporated vs Rentokil Initial plc

Annual Revenue Comparison: Snap-on Incorporated vs Allegion plc
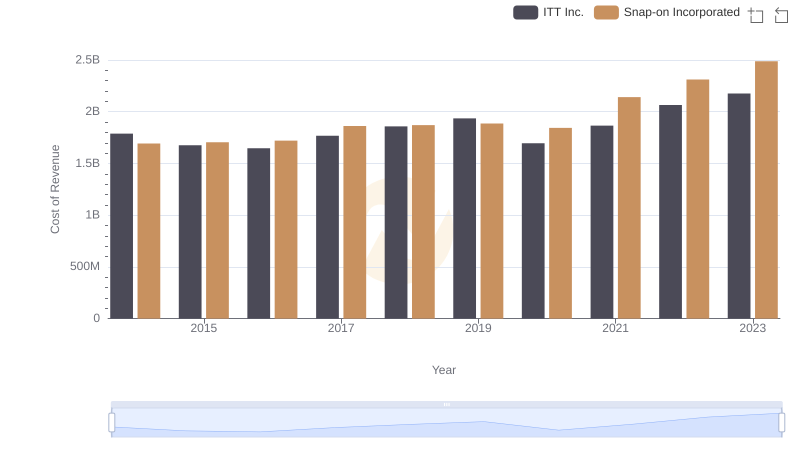
Analyzing Cost of Revenue: Snap-on Incorporated and ITT Inc.

Cost Insights: Breaking Down Snap-on Incorporated and TFI International Inc.'s Expenses
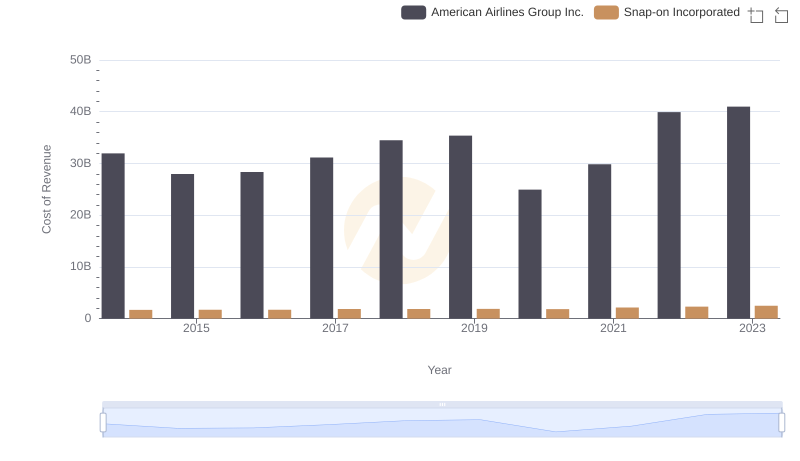
Snap-on Incorporated vs American Airlines Group Inc.: Efficiency in Cost of Revenue Explored
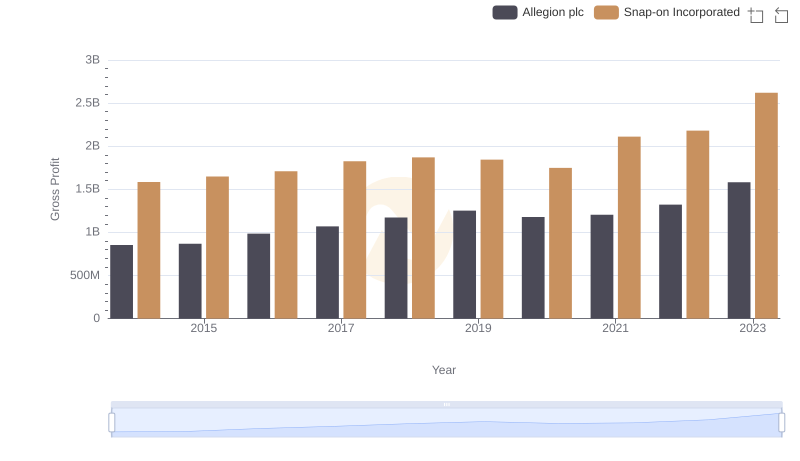
Gross Profit Comparison: Snap-on Incorporated and Allegion plc Trends
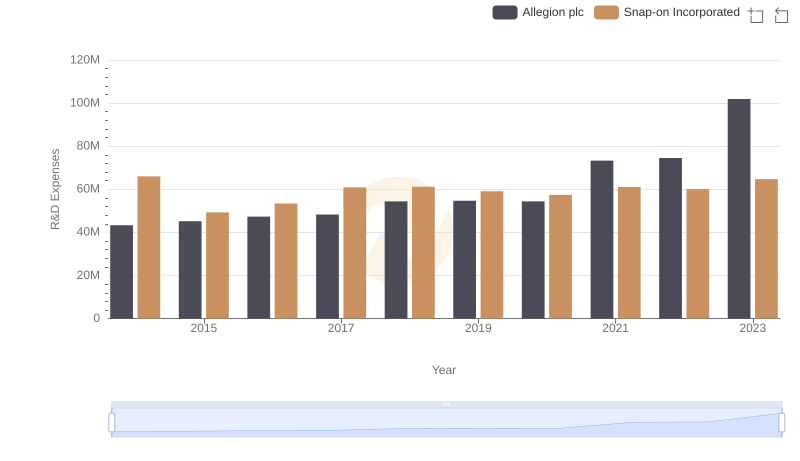
Research and Development Investment: Snap-on Incorporated vs Allegion plc
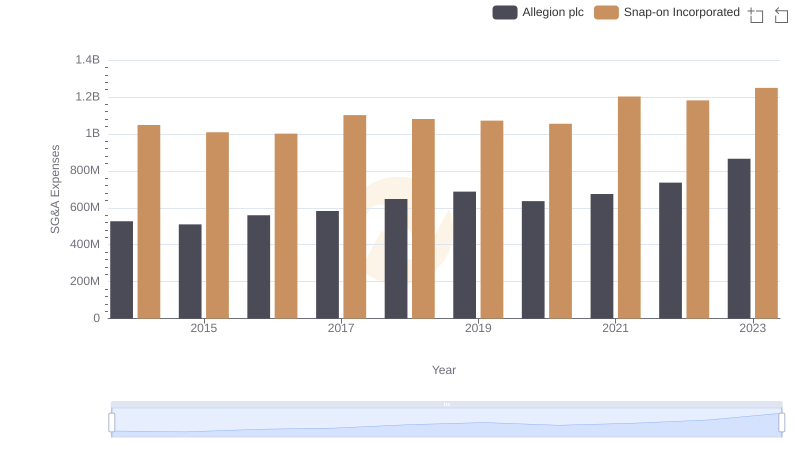
Snap-on Incorporated vs Allegion plc: SG&A Expense Trends
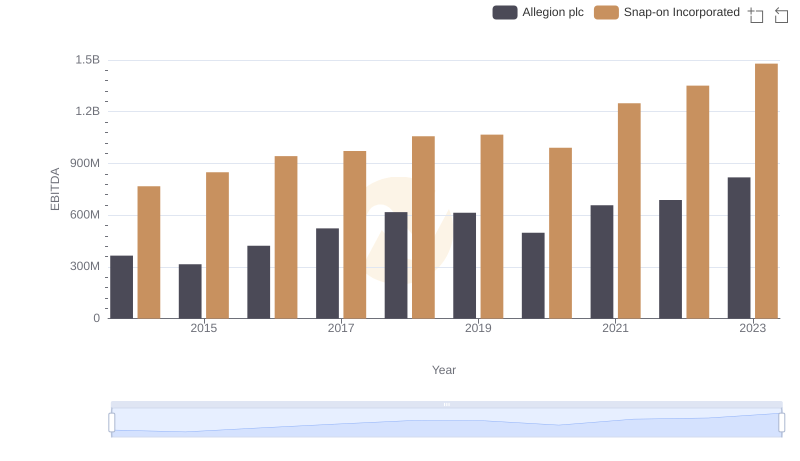
Snap-on Incorporated vs Allegion plc: In-Depth EBITDA Performance Comparison