| __timestamp | Allegion plc | Snap-on Incorporated |
|---|---|---|
| Wednesday, January 1, 2014 | 2118300000 | 3277700000 |
| Thursday, January 1, 2015 | 2068100000 | 3352800000 |
| Friday, January 1, 2016 | 2238000000 | 3430400000 |
| Sunday, January 1, 2017 | 2408200000 | 3686900000 |
| Monday, January 1, 2018 | 2731700000 | 3740700000 |
| Tuesday, January 1, 2019 | 2854000000 | 3730000000 |
| Wednesday, January 1, 2020 | 2719900000 | 3592500000 |
| Friday, January 1, 2021 | 2867400000 | 4252000000 |
| Saturday, January 1, 2022 | 3271900000 | 4492800000 |
| Sunday, January 1, 2023 | 3650800000 | 5108300000 |
| Monday, January 1, 2024 | 3772200000 | 4707400000 |
Unleashing insights
In the ever-evolving landscape of industrial tools and security solutions, Snap-on Incorporated and Allegion plc have emerged as formidable players. Over the past decade, Snap-on has consistently outperformed Allegion in terms of revenue, showcasing a robust growth trajectory. From 2014 to 2023, Snap-on's revenue surged by approximately 56%, reaching a peak in 2023. In contrast, Allegion's revenue grew by about 72% during the same period, reflecting its strategic expansion in the security sector.
This comparison not only underscores the competitive dynamics between these industry giants but also offers a glimpse into their strategic directions.
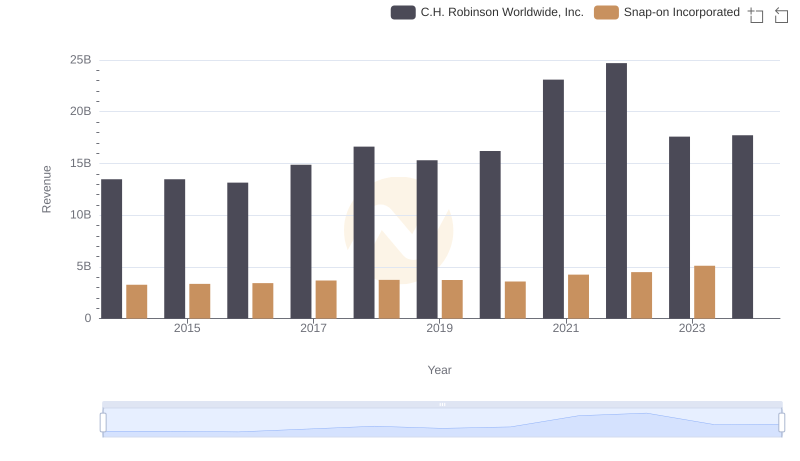
Snap-on Incorporated vs C.H. Robinson Worldwide, Inc.: Annual Revenue Growth Compared
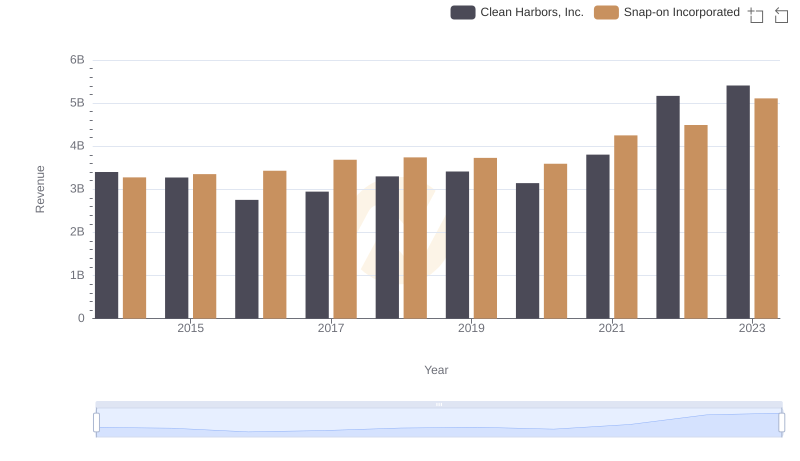
Snap-on Incorporated vs Clean Harbors, Inc.: Examining Key Revenue Metrics
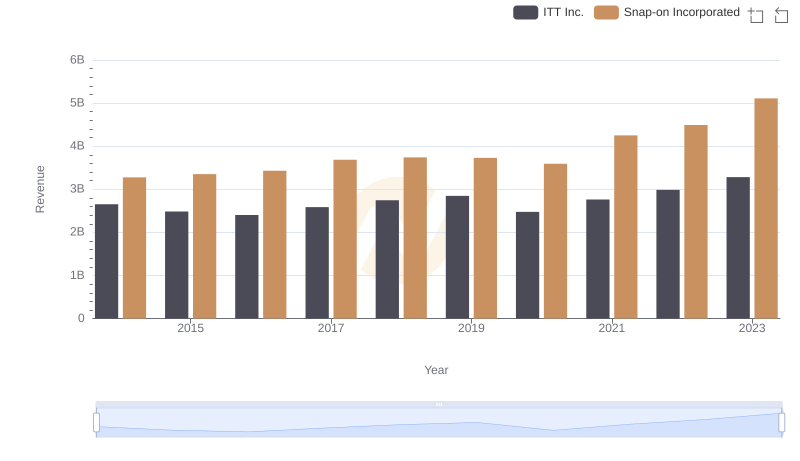
Snap-on Incorporated vs ITT Inc.: Annual Revenue Growth Compared
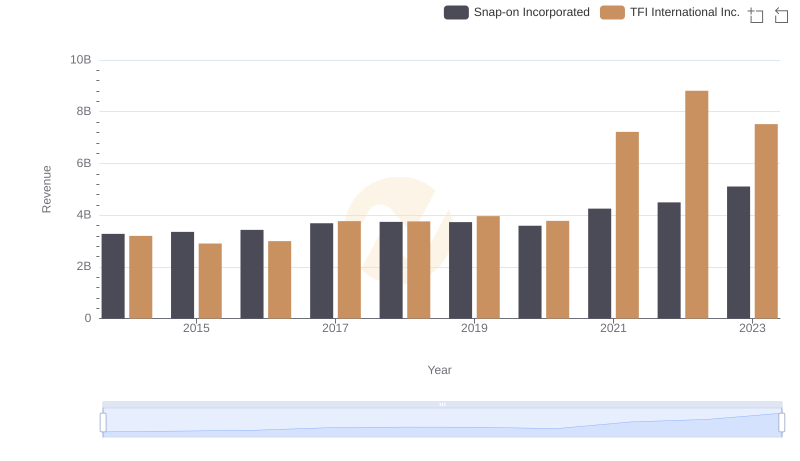
Annual Revenue Comparison: Snap-on Incorporated vs TFI International Inc.
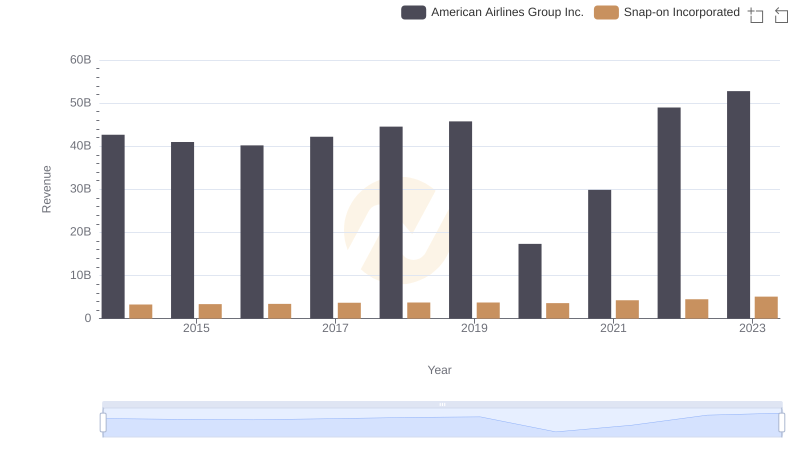
Revenue Insights: Snap-on Incorporated and American Airlines Group Inc. Performance Compared
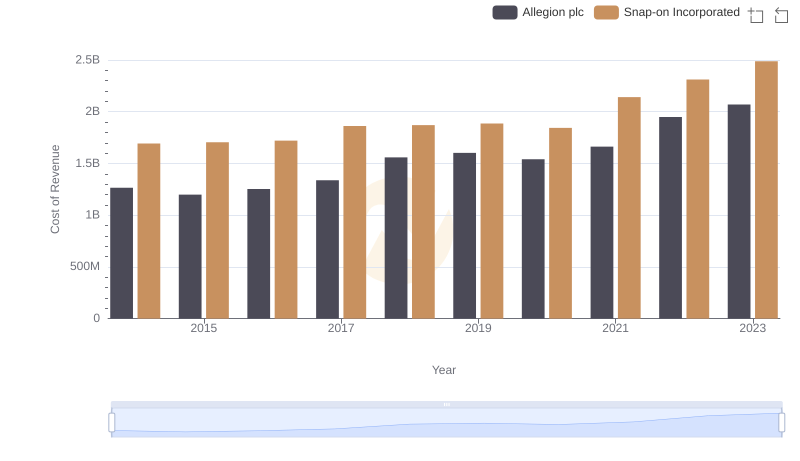
Comparing Cost of Revenue Efficiency: Snap-on Incorporated vs Allegion plc
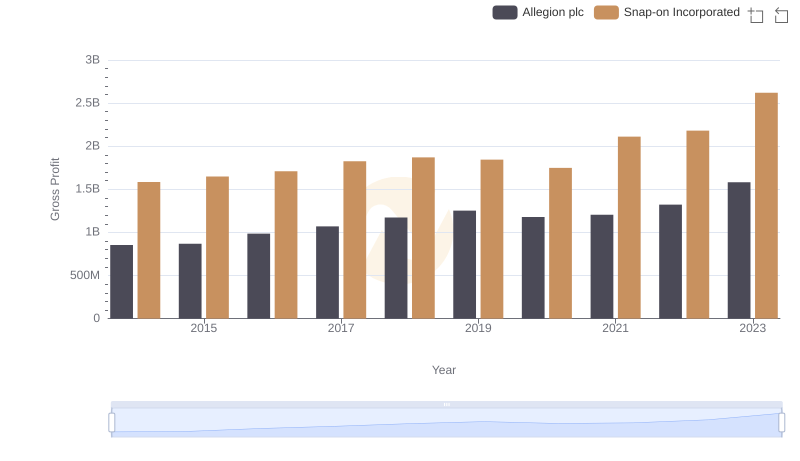
Gross Profit Comparison: Snap-on Incorporated and Allegion plc Trends
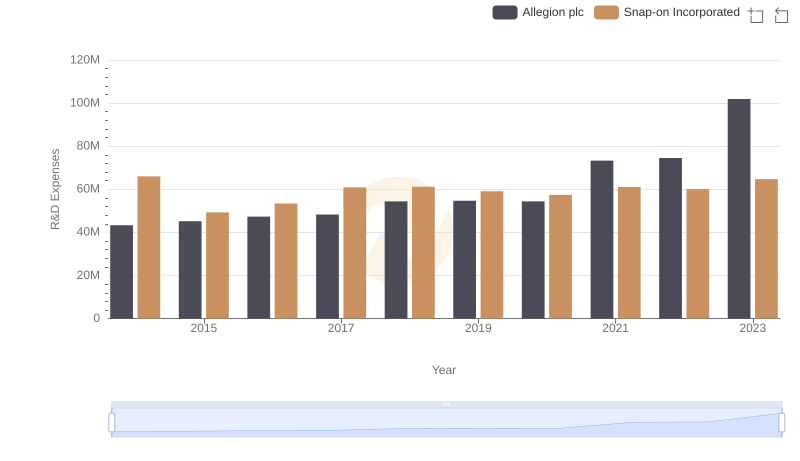
Research and Development Investment: Snap-on Incorporated vs Allegion plc
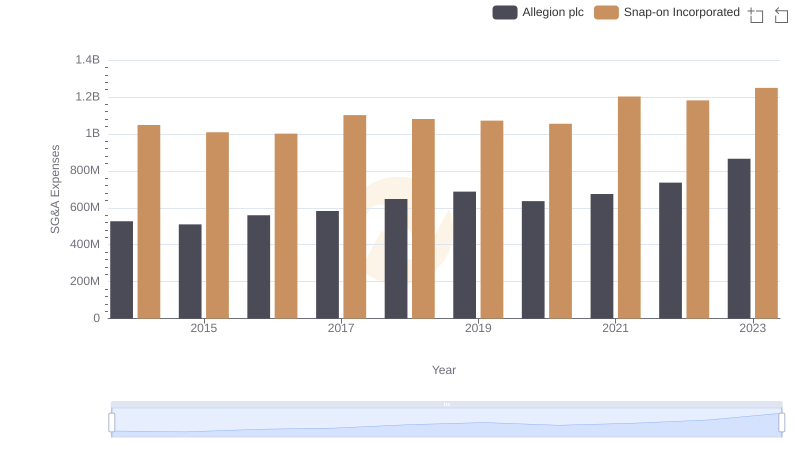
Snap-on Incorporated vs Allegion plc: SG&A Expense Trends
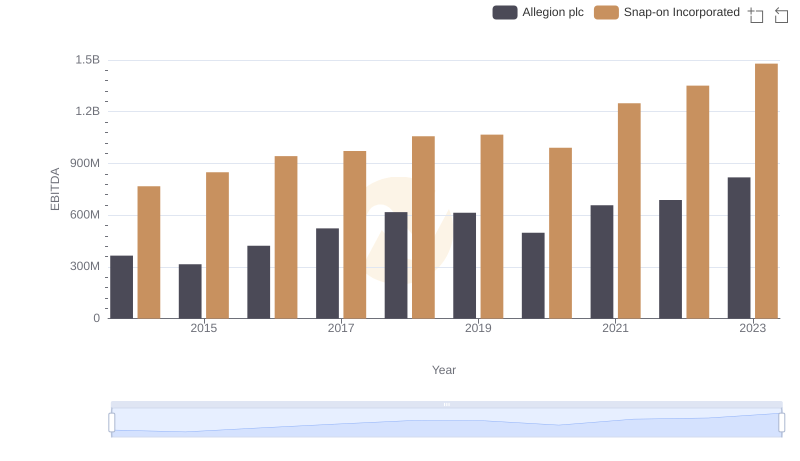
Snap-on Incorporated vs Allegion plc: In-Depth EBITDA Performance Comparison