| __timestamp | CNH Industrial N.V. | Canadian National Railway Company |
|---|---|---|
| Wednesday, January 1, 2014 | 25534000000 | 7142000000 |
| Thursday, January 1, 2015 | 20357000000 | 6951000000 |
| Friday, January 1, 2016 | 19539000000 | 6362000000 |
| Sunday, January 1, 2017 | 21621000000 | 7366000000 |
| Monday, January 1, 2018 | 22958000000 | 8359000000 |
| Tuesday, January 1, 2019 | 21832000000 | 8832000000 |
| Wednesday, January 1, 2020 | 21327000000 | 8048000000 |
| Friday, January 1, 2021 | 25951000000 | 8408000000 |
| Saturday, January 1, 2022 | 16797000000 | 9711000000 |
| Sunday, January 1, 2023 | 16805000000 | 9677000000 |
Unleashing insights
In the ever-evolving landscape of global transportation and industrial sectors, cost efficiency remains a pivotal factor for success. This analysis delves into the cost of revenue trends for Canadian National Railway Company and CNH Industrial N.V. from 2014 to 2023. Over this period, CNH Industrial's cost of revenue fluctuated significantly, peaking in 2021 and then dropping by approximately 35% by 2023. In contrast, Canadian National Railway demonstrated a more stable trajectory, with a gradual increase of about 36% over the same period.
This comparative analysis highlights the importance of strategic cost management in maintaining competitive advantage in the transportation and industrial sectors.
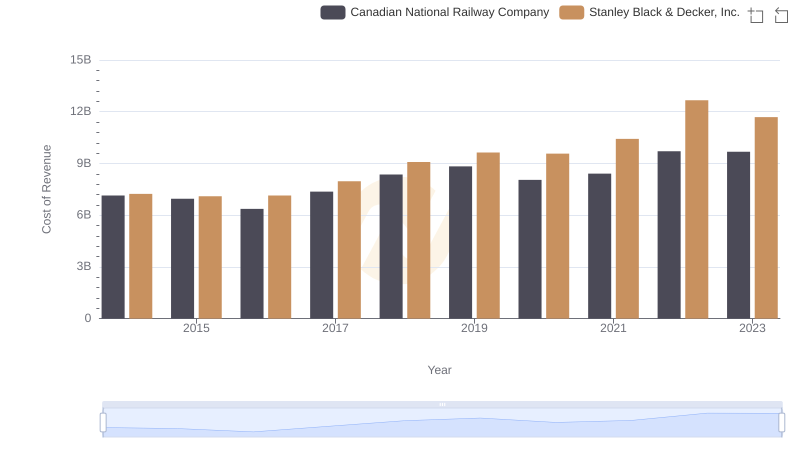
Comparing Cost of Revenue Efficiency: Canadian National Railway Company vs Stanley Black & Decker, Inc.
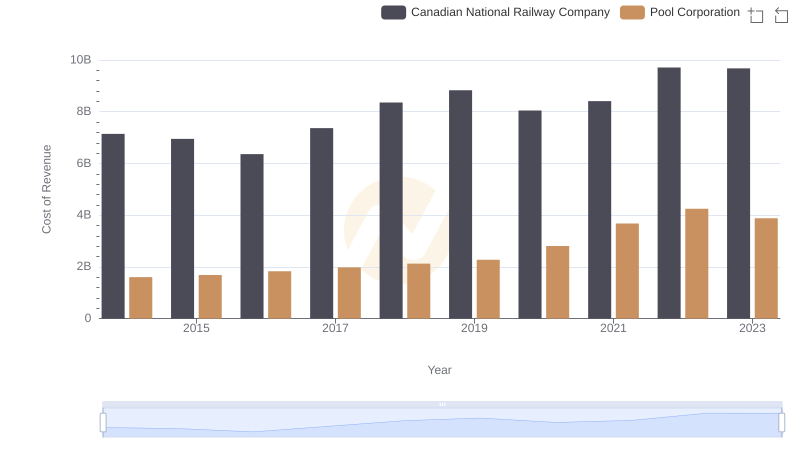
Analyzing Cost of Revenue: Canadian National Railway Company and Pool Corporation

Cost of Revenue Trends: Canadian National Railway Company vs AECOM
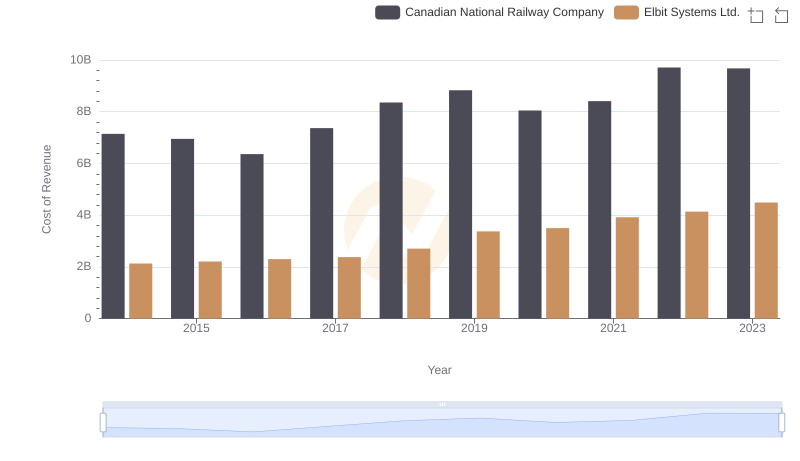
Analyzing Cost of Revenue: Canadian National Railway Company and Elbit Systems Ltd.
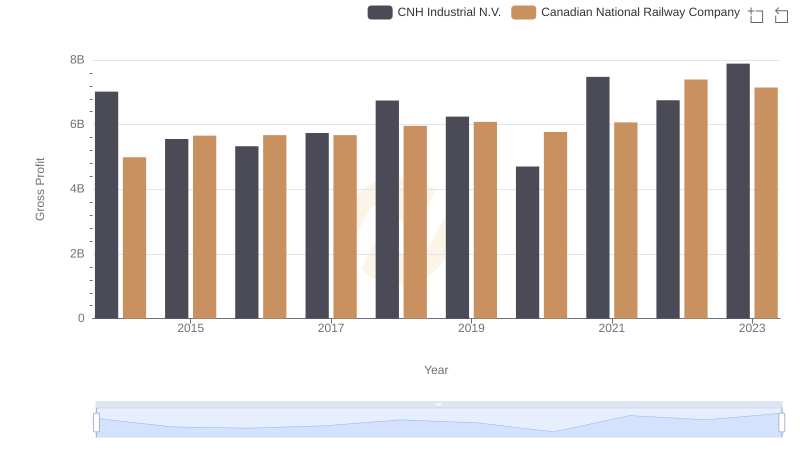
Gross Profit Analysis: Comparing Canadian National Railway Company and CNH Industrial N.V.
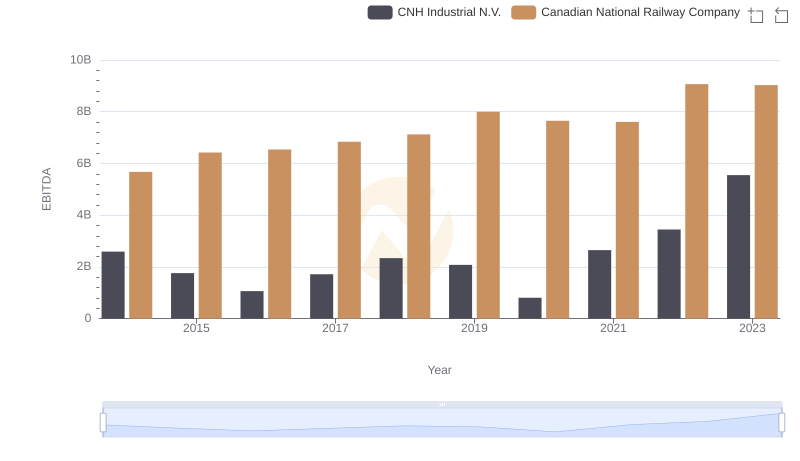
A Professional Review of EBITDA: Canadian National Railway Company Compared to CNH Industrial N.V.