| __timestamp | AMETEK, Inc. | Deere & Company |
|---|---|---|
| Wednesday, January 1, 2014 | 4021964000 | 35242700000 |
| Thursday, January 1, 2015 | 3974295000 | 28156300000 |
| Friday, January 1, 2016 | 3840087000 | 25898500000 |
| Sunday, January 1, 2017 | 4300170000 | 28616600000 |
| Monday, January 1, 2018 | 4845872000 | 36457300000 |
| Tuesday, January 1, 2019 | 5158557000 | 38379000000 |
| Wednesday, January 1, 2020 | 4540029000 | 34722000000 |
| Friday, January 1, 2021 | 5546514000 | 43033000000 |
| Saturday, January 1, 2022 | 6150530000 | 52577000000 |
| Sunday, January 1, 2023 | 6596950000 | 61222000000 |
| Monday, January 1, 2024 | 6941180000 | 44759000000 |
Unleashing the power of data
In the ever-evolving landscape of industrial giants, Deere & Company and AMETEK, Inc. have showcased intriguing revenue trajectories over the past decade. From 2014 to 2023, Deere & Company has consistently outperformed AMETEK, Inc., with revenues peaking at approximately $61 billion in 2023, marking a robust 73% increase from its 2016 low. Meanwhile, AMETEK, Inc. has demonstrated steady growth, achieving a 72% rise in revenue from 2016 to 2023, reaching around $6.6 billion.
Deere & Company's revenue surge can be attributed to its strategic expansion in agricultural and construction equipment, while AMETEK, Inc.'s growth reflects its focus on electronic instruments and electromechanical devices. Despite the missing data for 2024, these trends highlight the resilience and adaptability of both companies in navigating economic fluctuations and market demands.
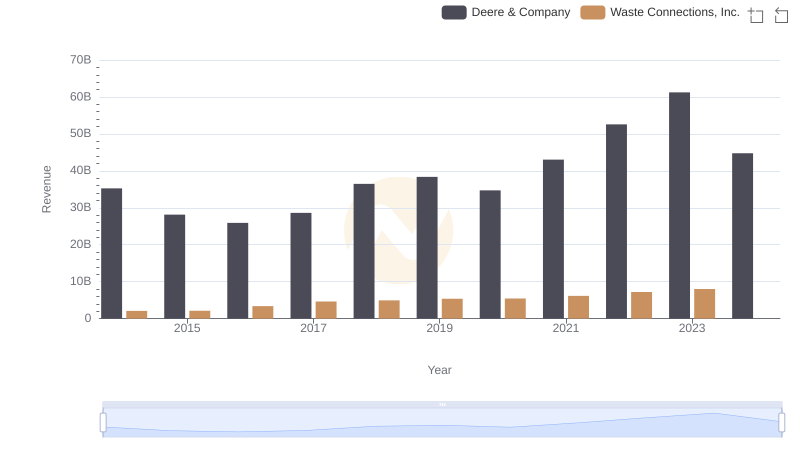
Who Generates More Revenue? Deere & Company or Waste Connections, Inc.
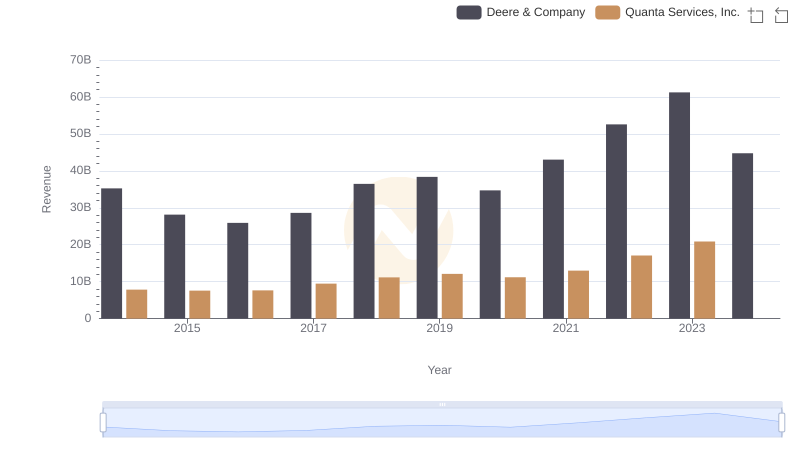
Deere & Company and Quanta Services, Inc.: A Comprehensive Revenue Analysis
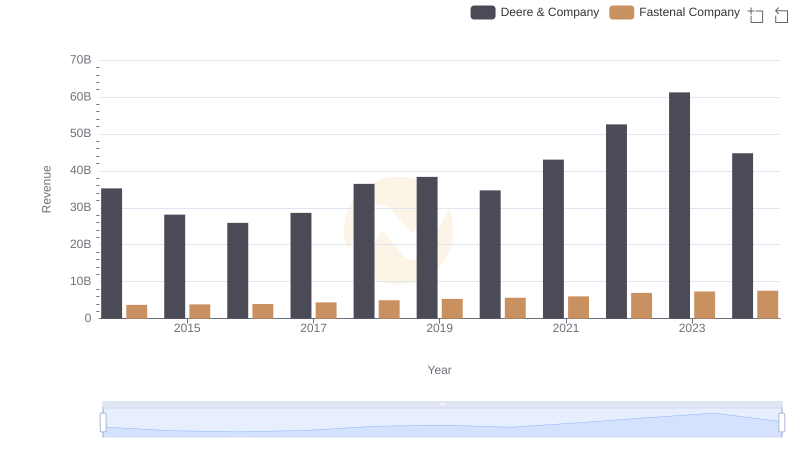
Annual Revenue Comparison: Deere & Company vs Fastenal Company
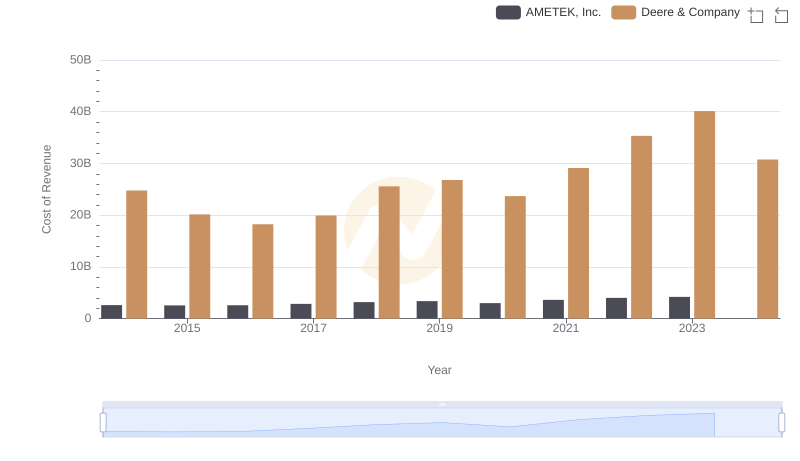
Cost of Revenue: Key Insights for Deere & Company and AMETEK, Inc.
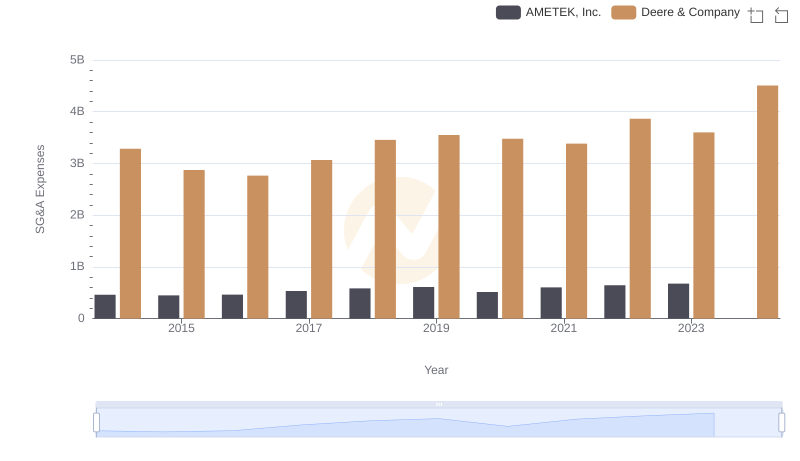
Who Optimizes SG&A Costs Better? Deere & Company or AMETEK, Inc.
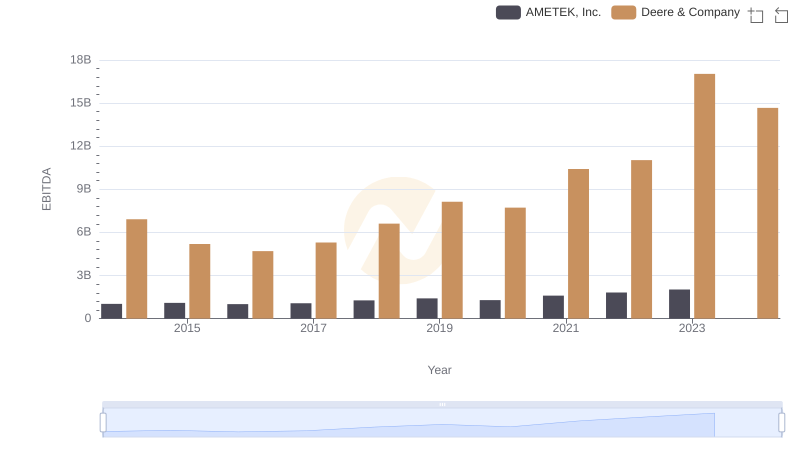
A Professional Review of EBITDA: Deere & Company Compared to AMETEK, Inc.