| __timestamp | Deere & Company | Fastenal Company |
|---|---|---|
| Wednesday, January 1, 2014 | 35242700000 | 3733507000 |
| Thursday, January 1, 2015 | 28156300000 | 3869187000 |
| Friday, January 1, 2016 | 25898500000 | 3962036000 |
| Sunday, January 1, 2017 | 28616600000 | 4390500000 |
| Monday, January 1, 2018 | 36457300000 | 4965100000 |
| Tuesday, January 1, 2019 | 38379000000 | 5333700000 |
| Wednesday, January 1, 2020 | 34722000000 | 5647300000 |
| Friday, January 1, 2021 | 43033000000 | 6010900000 |
| Saturday, January 1, 2022 | 52577000000 | 6980600000 |
| Sunday, January 1, 2023 | 61222000000 | 7346700000 |
| Monday, January 1, 2024 | 44759000000 | 7546000000 |
Unleashing insights
In the world of industrial and construction equipment, Deere & Company and Fastenal Company stand as titans. Over the past decade, Deere & Company has consistently outperformed Fastenal in terms of revenue, showcasing a robust growth trajectory. From 2014 to 2023, Deere's revenue surged by approximately 74%, peaking in 2023. In contrast, Fastenal's revenue grew by about 97% during the same period, reflecting its steady expansion in the fastener and industrial supply market.
Deere & Company experienced a significant revenue increase in 2022, reaching its highest point in 2023. Fastenal, while smaller in scale, demonstrated consistent growth, with its revenue nearly doubling over the decade. This comparison highlights the dynamic nature of the industrial sector, where both companies have carved out substantial market shares.
As we look to the future, both companies are poised for continued growth, driven by innovation and market demand.
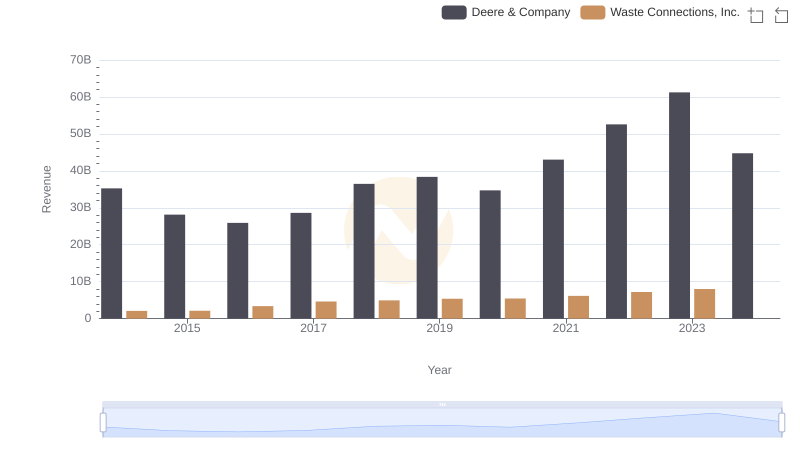
Who Generates More Revenue? Deere & Company or Waste Connections, Inc.
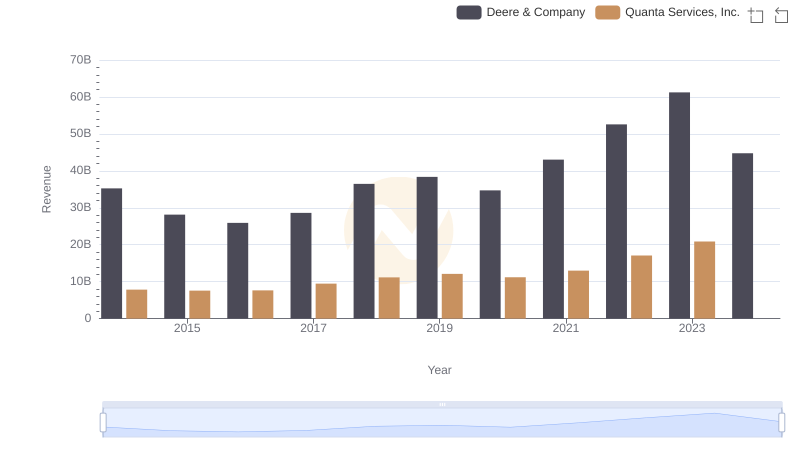
Deere & Company and Quanta Services, Inc.: A Comprehensive Revenue Analysis
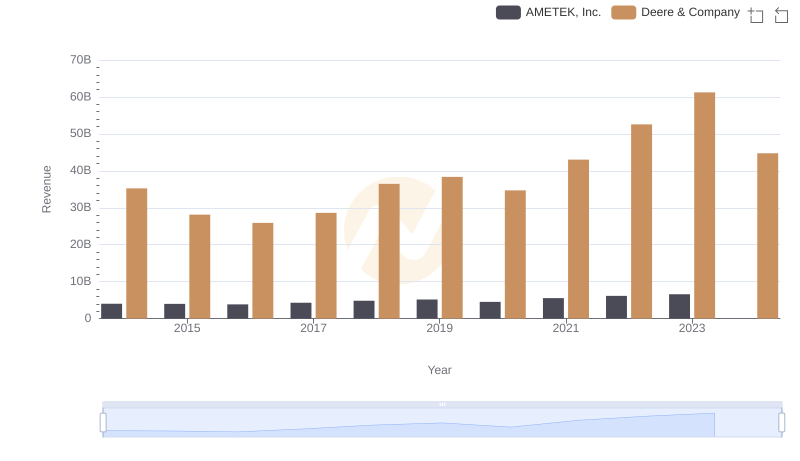
Breaking Down Revenue Trends: Deere & Company vs AMETEK, Inc.
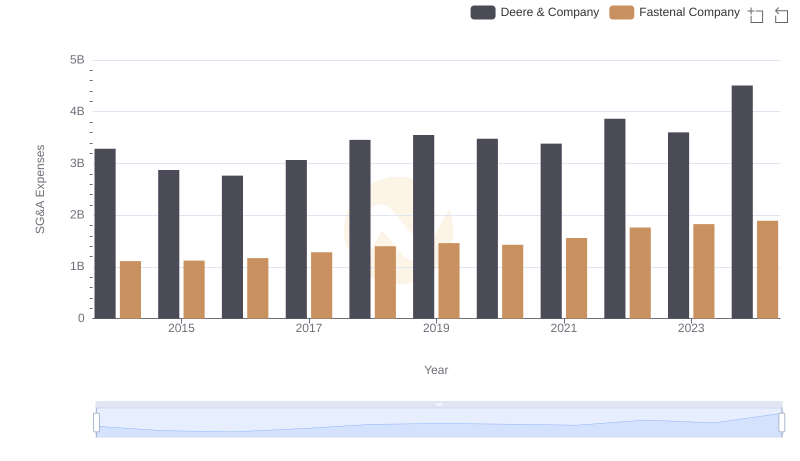
Selling, General, and Administrative Costs: Deere & Company vs Fastenal Company
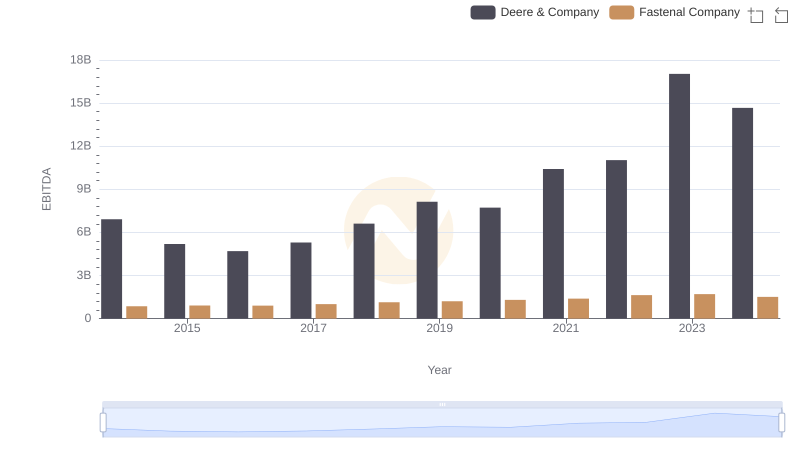
A Side-by-Side Analysis of EBITDA: Deere & Company and Fastenal Company