| __timestamp | Caterpillar Inc. | General Dynamics Corporation |
|---|---|---|
| Wednesday, January 1, 2014 | 55184000000 | 30852000000 |
| Thursday, January 1, 2015 | 47011000000 | 31469000000 |
| Friday, January 1, 2016 | 38537000000 | 31353000000 |
| Sunday, January 1, 2017 | 45462000000 | 30973000000 |
| Monday, January 1, 2018 | 54722000000 | 36193000000 |
| Tuesday, January 1, 2019 | 53800000000 | 39350000000 |
| Wednesday, January 1, 2020 | 41748000000 | 37925000000 |
| Friday, January 1, 2021 | 50971000000 | 38469000000 |
| Saturday, January 1, 2022 | 59427000000 | 39407000000 |
| Sunday, January 1, 2023 | 67060000000 | 42272000000 |
| Monday, January 1, 2024 | 64809000000 | 47716000000 |
Cracking the code
In the ever-evolving landscape of industrial giants, Caterpillar Inc. and General Dynamics Corporation have been pivotal players. Over the past decade, Caterpillar's revenue has seen a remarkable journey, peaking in 2023 with a 74% increase from its 2016 low. This growth reflects Caterpillar's resilience and adaptability in the face of global economic challenges. Meanwhile, General Dynamics has maintained a steady upward trajectory, with a 37% revenue increase from 2014 to 2023, showcasing its robust defense and aerospace sectors.
The data reveals a fascinating trend: while Caterpillar experienced fluctuations, General Dynamics displayed consistent growth, culminating in its highest revenue in 2024. This comparison highlights the diverse strategies and market conditions influencing these industrial titans. As we look to the future, the missing data for Caterpillar in 2024 leaves room for speculation on its next strategic move.

Caterpillar Inc. vs 3M Company: Examining Key Revenue Metrics

Caterpillar Inc. vs TransDigm Group Incorporated: Annual Revenue Growth Compared

Caterpillar Inc. vs Canadian Pacific Railway Limited: Examining Key Revenue Metrics
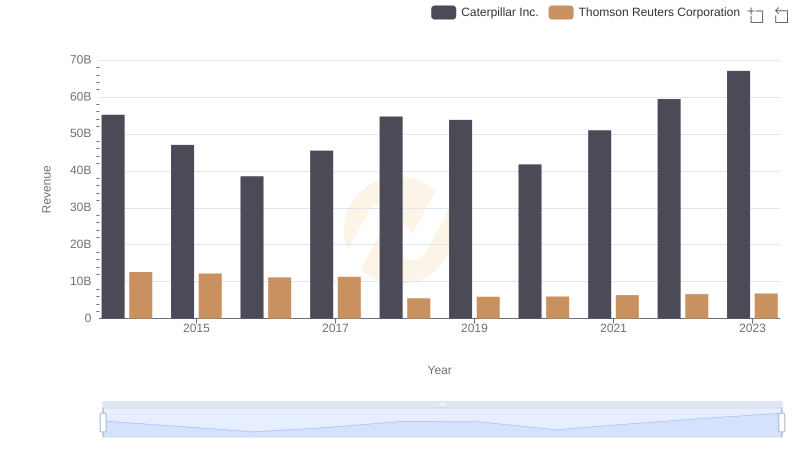
Comparing Revenue Performance: Caterpillar Inc. or Thomson Reuters Corporation?

Caterpillar Inc. vs General Dynamics Corporation: SG&A Expense Trends