| __timestamp | Apple Inc. | Arista Networks, Inc. |
|---|---|---|
| Wednesday, January 1, 2014 | 112258000000 | 192015000 |
| Thursday, January 1, 2015 | 140089000000 | 294031000 |
| Friday, January 1, 2016 | 131376000000 | 406051000 |
| Sunday, January 1, 2017 | 141048000000 | 584417000 |
| Monday, January 1, 2018 | 163756000000 | 777992000 |
| Tuesday, January 1, 2019 | 161782000000 | 866368000 |
| Wednesday, January 1, 2020 | 169559000000 | 835626000 |
| Friday, January 1, 2021 | 212981000000 | 1067258000 |
| Saturday, January 1, 2022 | 223546000000 | 1705614000 |
| Sunday, January 1, 2023 | 214137000000 | 2229887000 |
| Monday, January 1, 2024 | 210352000000 | 2511843000 |
Unveiling the hidden dimensions of data
In the ever-evolving tech landscape, understanding the cost of revenue is crucial for assessing a company's financial health. From 2014 to 2023, Apple Inc. and Arista Networks, Inc. have shown distinct trajectories in their cost of revenue. Apple, a titan in consumer electronics, saw its cost of revenue grow by approximately 90%, peaking in 2022. This reflects its expanding product line and market dominance. Meanwhile, Arista Networks, a leader in cloud networking solutions, experienced a staggering 1,060% increase over the same period, highlighting its rapid growth and increasing market share.
Interestingly, 2024 data for Arista Networks is missing, leaving room for speculation about its future performance. As these companies continue to innovate, their cost of revenue trends offer valuable insights into their strategic priorities and market dynamics.
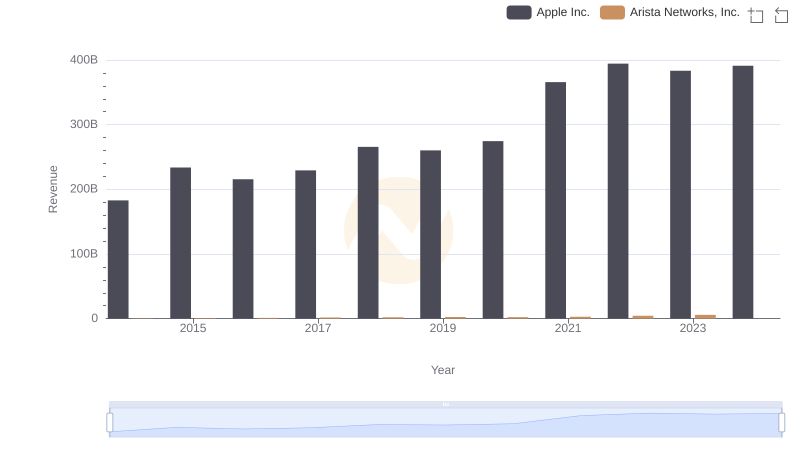
Revenue Showdown: Apple Inc. vs Arista Networks, Inc.
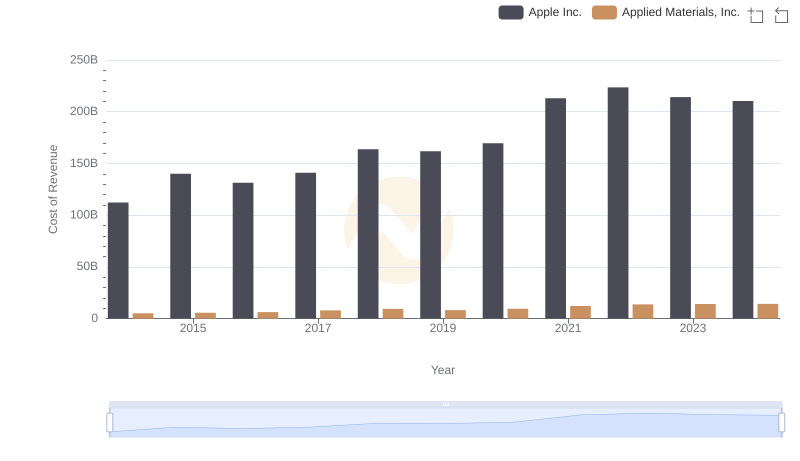
Apple Inc. vs Applied Materials, Inc.: Efficiency in Cost of Revenue Explored
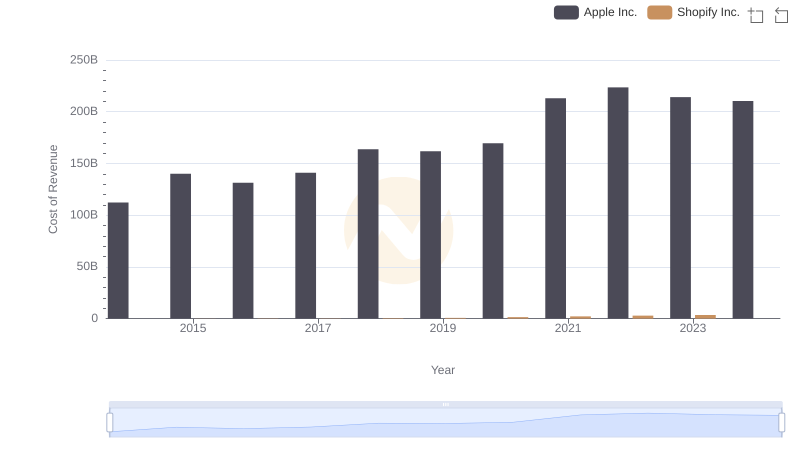
Analyzing Cost of Revenue: Apple Inc. and Shopify Inc.
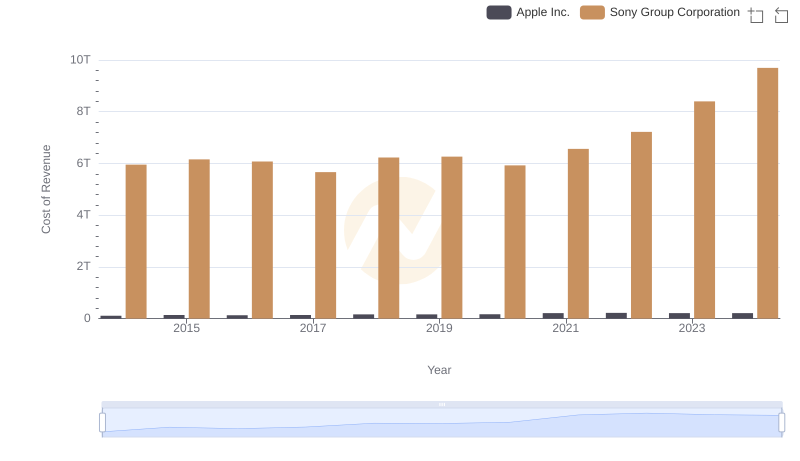
Cost Insights: Breaking Down Apple Inc. and Sony Group Corporation's Expenses
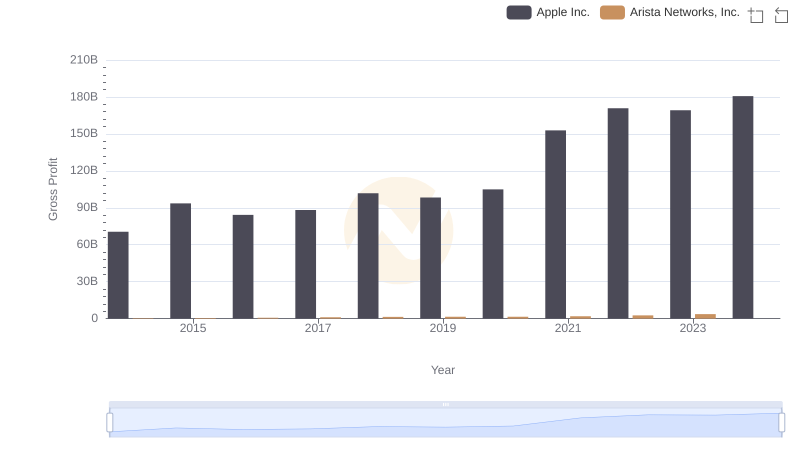
Key Insights on Gross Profit: Apple Inc. vs Arista Networks, Inc.
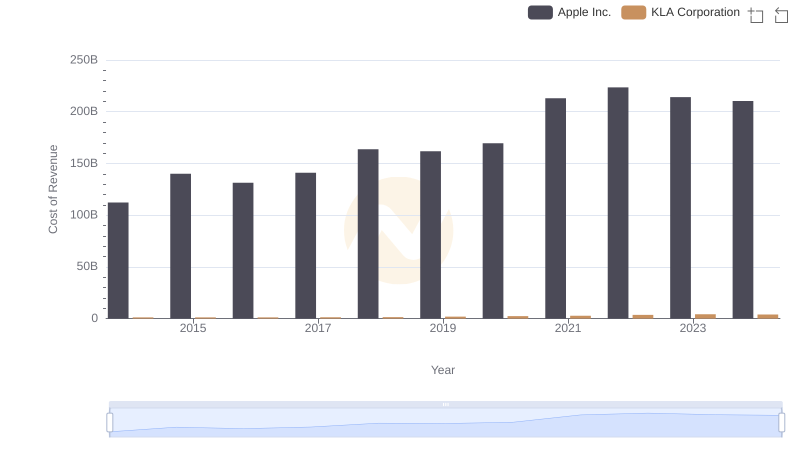
Apple Inc. vs KLA Corporation: Efficiency in Cost of Revenue Explored
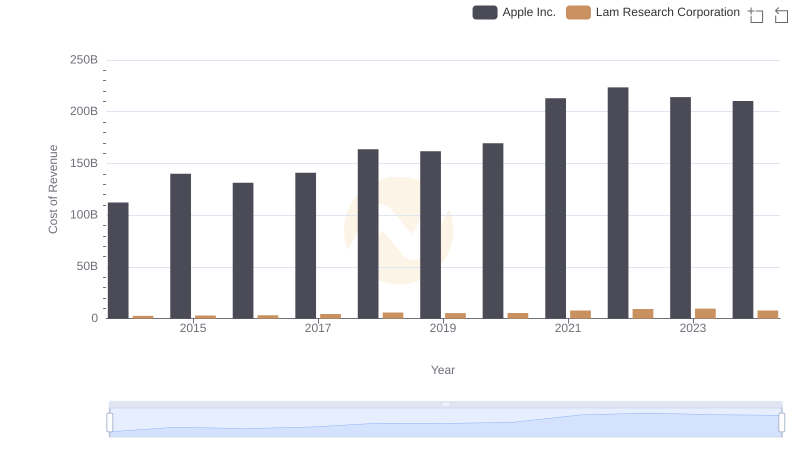
Cost of Revenue Trends: Apple Inc. vs Lam Research Corporation
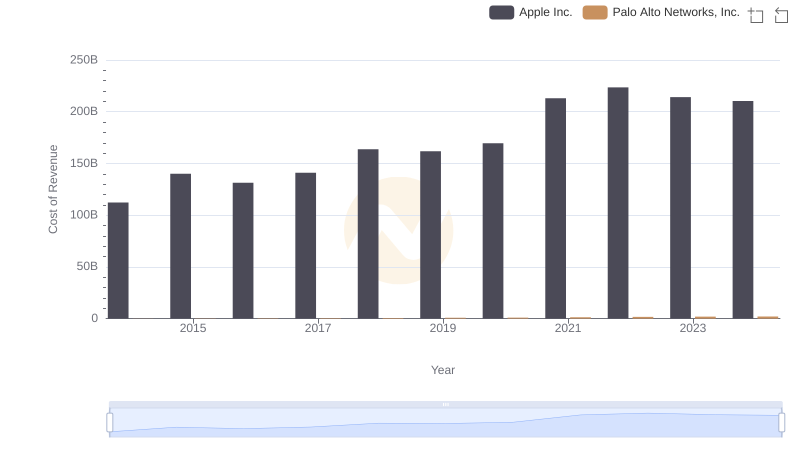
Cost of Revenue: Key Insights for Apple Inc. and Palo Alto Networks, Inc.

Cost of Revenue Trends: Apple Inc. vs Micron Technology, Inc.
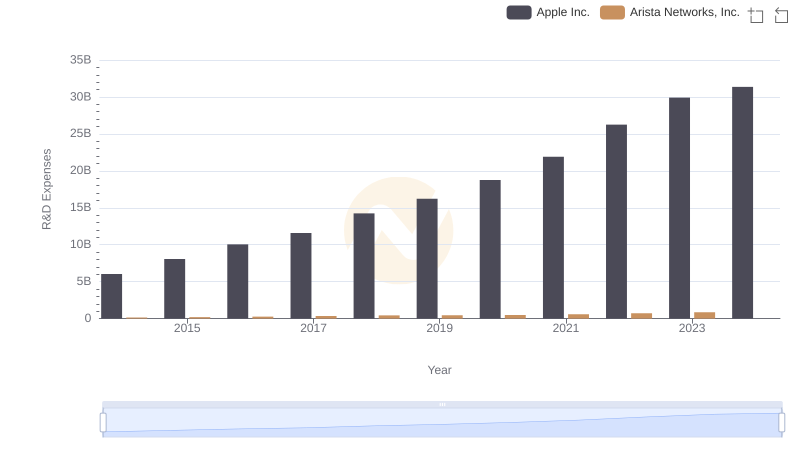
Apple Inc. or Arista Networks, Inc.: Who Invests More in Innovation?
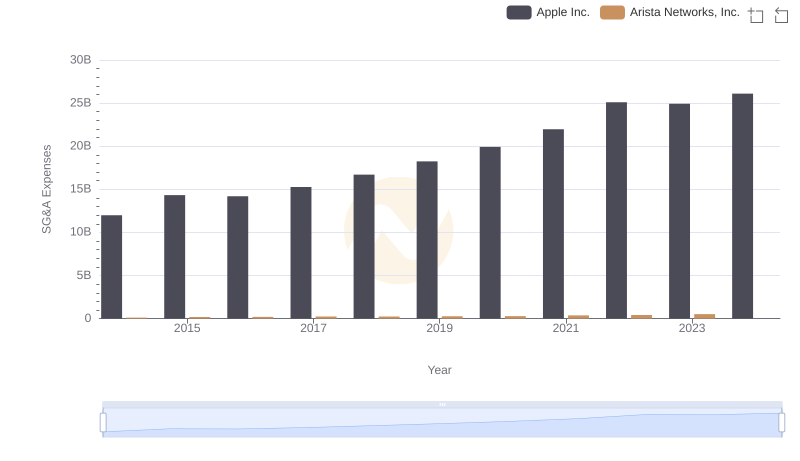
Apple Inc. and Arista Networks, Inc.: SG&A Spending Patterns Compared
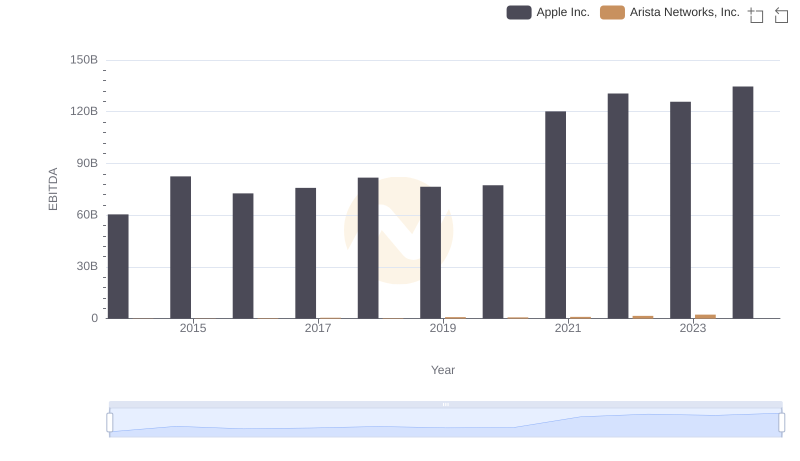
Comprehensive EBITDA Comparison: Apple Inc. vs Arista Networks, Inc.