| __timestamp | Apple Inc. | Micron Technology, Inc. |
|---|---|---|
| Wednesday, January 1, 2014 | 112258000000 | 10921000000 |
| Thursday, January 1, 2015 | 140089000000 | 10977000000 |
| Friday, January 1, 2016 | 131376000000 | 9894000000 |
| Sunday, January 1, 2017 | 141048000000 | 11886000000 |
| Monday, January 1, 2018 | 163756000000 | 12500000000 |
| Tuesday, January 1, 2019 | 161782000000 | 12704000000 |
| Wednesday, January 1, 2020 | 169559000000 | 14883000000 |
| Friday, January 1, 2021 | 212981000000 | 17282000000 |
| Saturday, January 1, 2022 | 223546000000 | 16860000000 |
| Sunday, January 1, 2023 | 214137000000 | 16956000000 |
| Monday, January 1, 2024 | 210352000000 | 19498000000 |
In pursuit of knowledge
In the ever-evolving landscape of technology, understanding cost dynamics is crucial. Over the past decade, Apple Inc. and Micron Technology, Inc. have showcased distinct trends in their cost of revenue. From 2014 to 2024, Apple has seen a steady increase, peaking in 2022 with a 99% rise from 2014 levels. This reflects Apple's strategic investments in innovation and supply chain efficiency. Meanwhile, Micron Technology's cost of revenue has grown by approximately 79% over the same period, highlighting its expansion in the semiconductor market. Notably, 2024 marks a significant year for Micron, with a 15% increase from the previous year, indicating a robust growth trajectory. These trends underscore the competitive nature of the tech industry, where managing costs is as critical as driving revenue. As we look to the future, these insights provide a window into the strategic priorities of two industry giants.
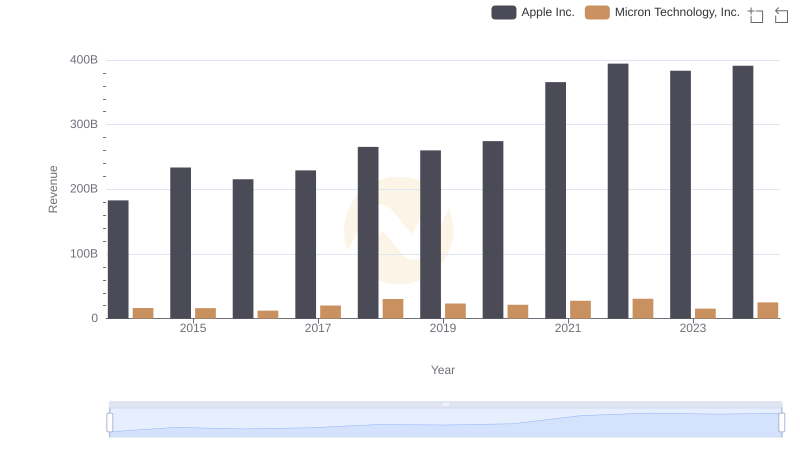
Apple Inc. vs Micron Technology, Inc.: Examining Key Revenue Metrics
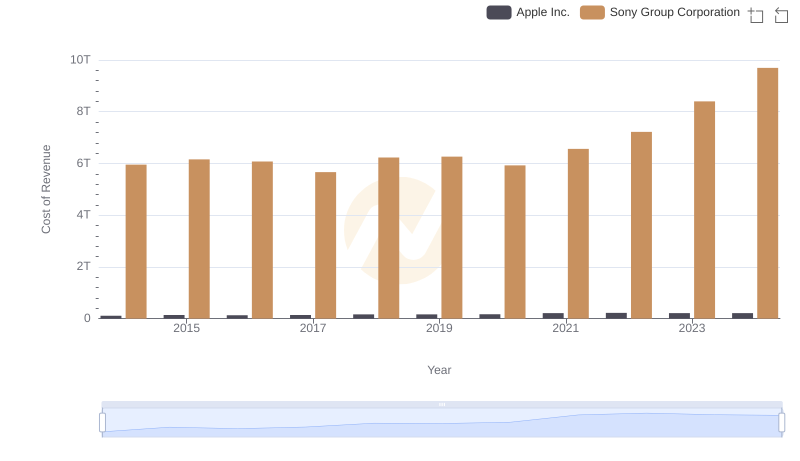
Cost Insights: Breaking Down Apple Inc. and Sony Group Corporation's Expenses
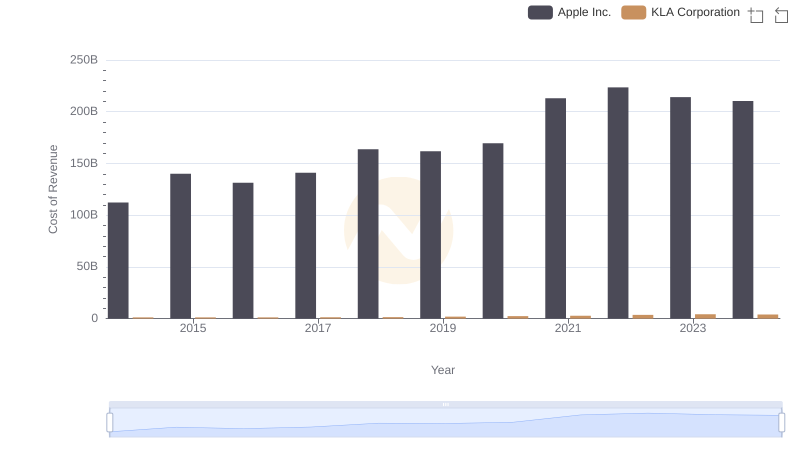
Apple Inc. vs KLA Corporation: Efficiency in Cost of Revenue Explored
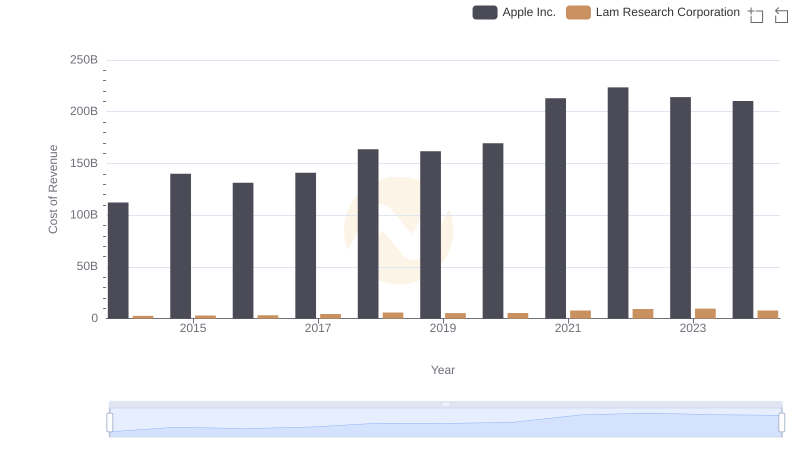
Cost of Revenue Trends: Apple Inc. vs Lam Research Corporation
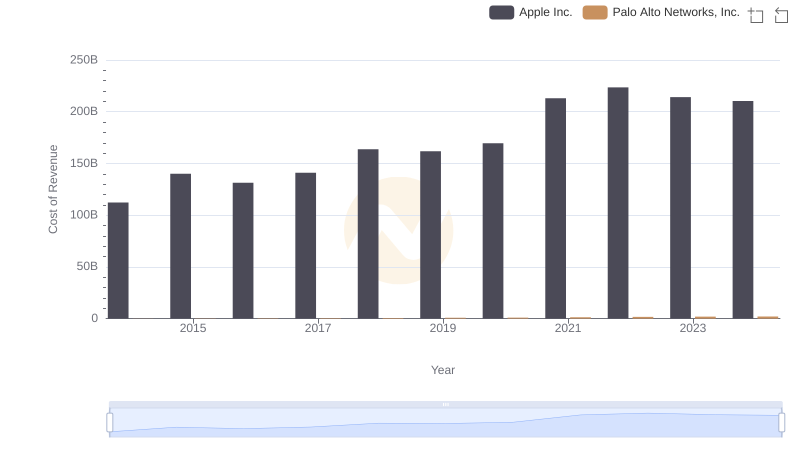
Cost of Revenue: Key Insights for Apple Inc. and Palo Alto Networks, Inc.
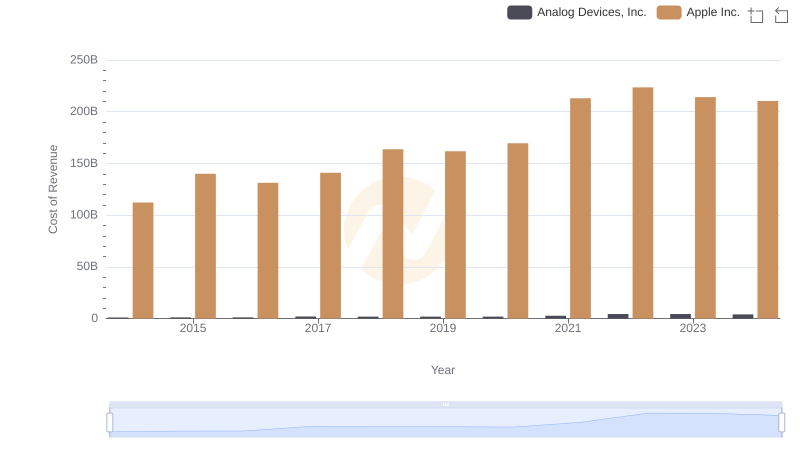
Cost of Revenue: Key Insights for Apple Inc. and Analog Devices, Inc.
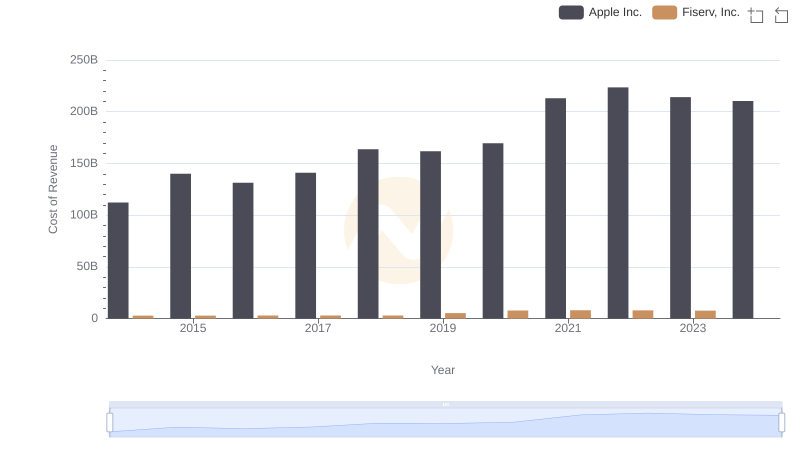
Cost of Revenue: Key Insights for Apple Inc. and Fiserv, Inc.

Comparing Cost of Revenue Efficiency: Apple Inc. vs Fiserv, Inc.
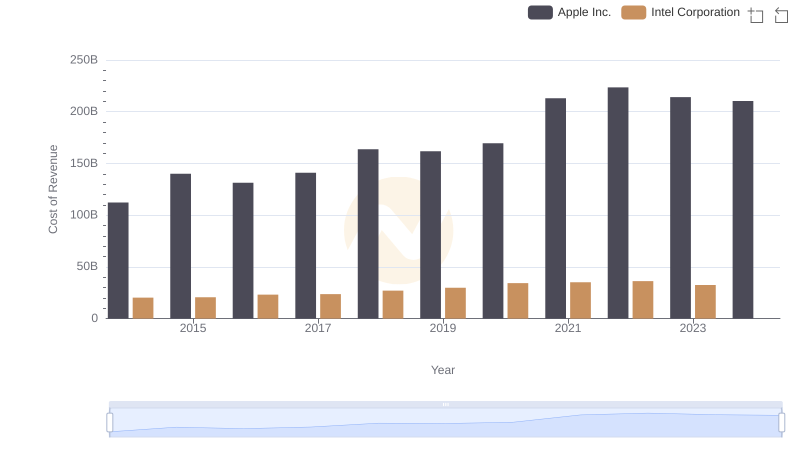
Apple Inc. vs Intel Corporation: Efficiency in Cost of Revenue Explored
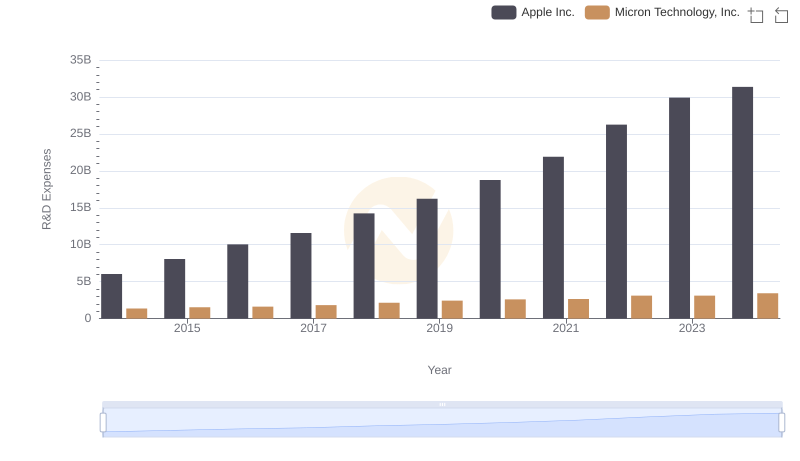
Research and Development Investment: Apple Inc. vs Micron Technology, Inc.
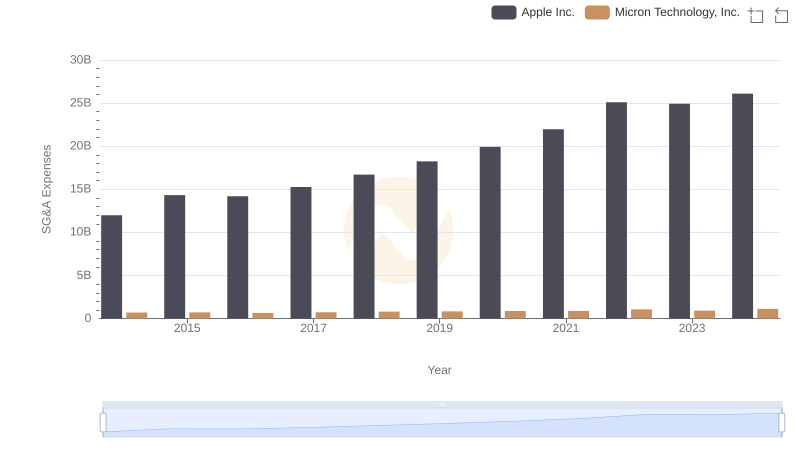
SG&A Efficiency Analysis: Comparing Apple Inc. and Micron Technology, Inc.
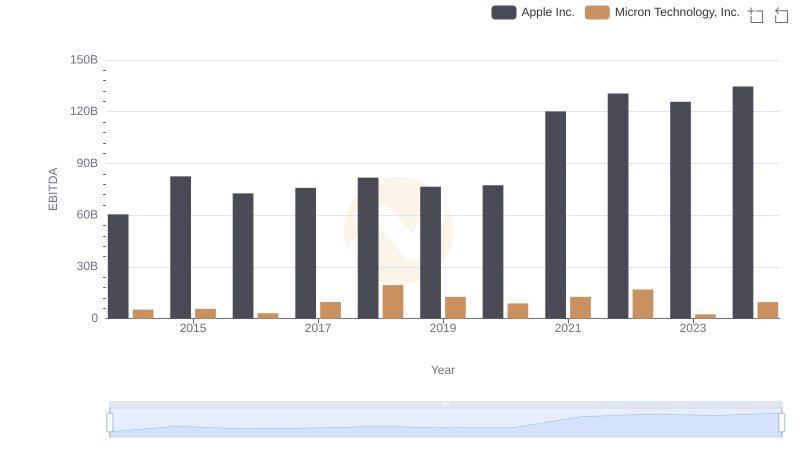
EBITDA Metrics Evaluated: Apple Inc. vs Micron Technology, Inc.