| __timestamp | Adobe Inc. | PTC Inc. |
|---|---|---|
| Wednesday, January 1, 2014 | 734698000 | 271574000 |
| Thursday, January 1, 2015 | 1277438000 | 125699999 |
| Friday, January 1, 2016 | 1837115000 | 49244000 |
| Sunday, January 1, 2017 | 2538040000 | 127736000 |
| Monday, January 1, 2018 | 3229610000 | 157737000 |
| Tuesday, January 1, 2019 | 4097396000 | 141171000 |
| Wednesday, January 1, 2020 | 5133000000 | 291951000 |
| Friday, January 1, 2021 | 6675000000 | 564767000 |
| Saturday, January 1, 2022 | 7055000000 | 573406000 |
| Sunday, January 1, 2023 | 6650000000 | 599145000 |
| Monday, January 1, 2024 | 7957000000 | 730022000 |
Unveiling the hidden dimensions of data
In the ever-evolving landscape of software giants, Adobe Inc. and PTC Inc. have showcased remarkable EBITDA growth over the past decade. Adobe's EBITDA surged by over 980% from 2014 to 2024, reflecting its strategic innovations and market expansion. In contrast, PTC Inc. experienced a more modest growth of approximately 170% during the same period, highlighting its steady yet impactful presence in the industry.
This comparison not only highlights the financial prowess of these companies but also offers a glimpse into their strategic directions and market positioning.
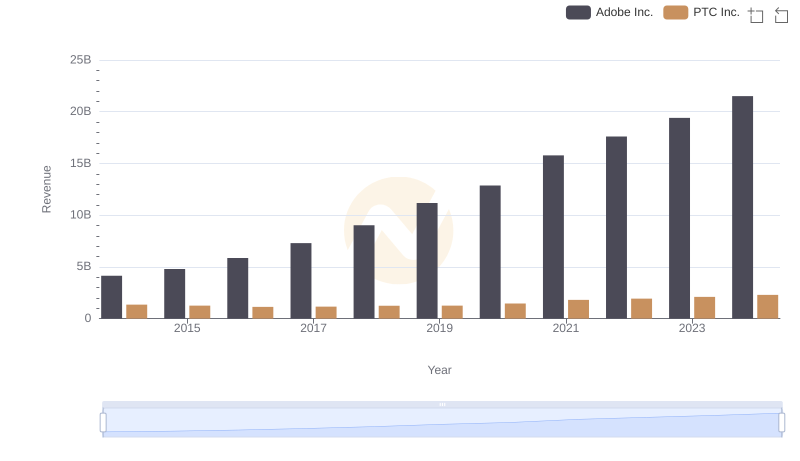
Adobe Inc. vs PTC Inc.: Examining Key Revenue Metrics
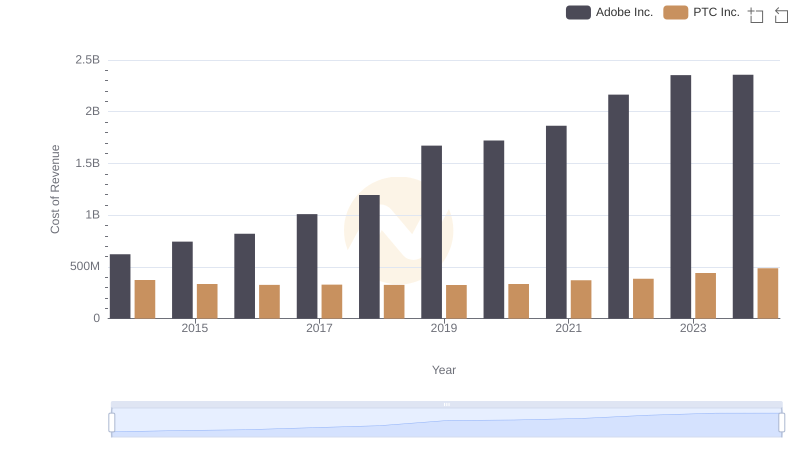
Analyzing Cost of Revenue: Adobe Inc. and PTC Inc.
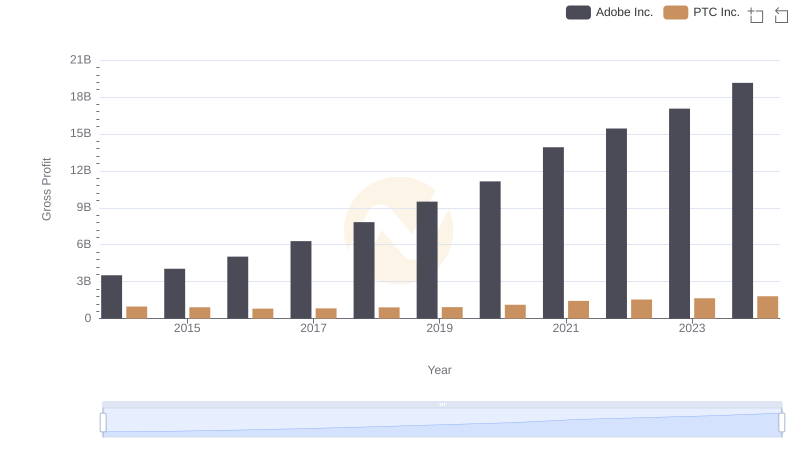
Adobe Inc. vs PTC Inc.: A Gross Profit Performance Breakdown
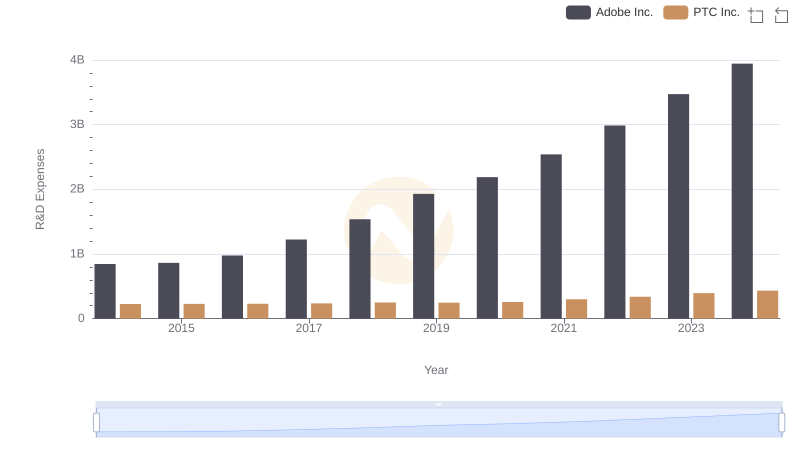
R&D Spending Showdown: Adobe Inc. vs PTC Inc.
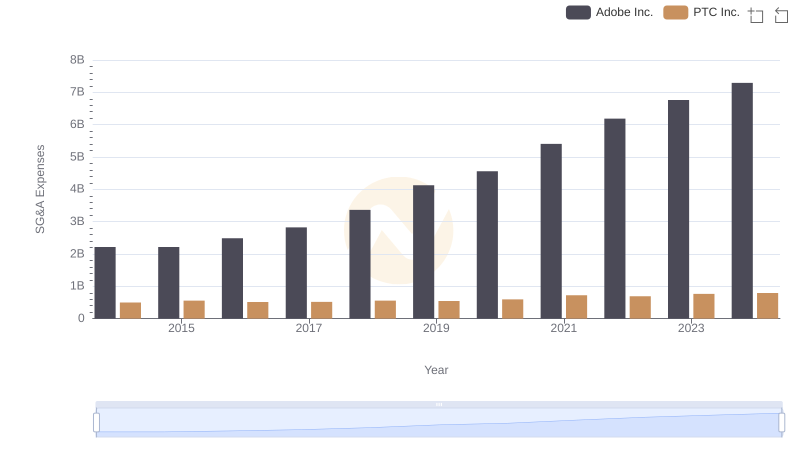
Selling, General, and Administrative Costs: Adobe Inc. vs PTC Inc.
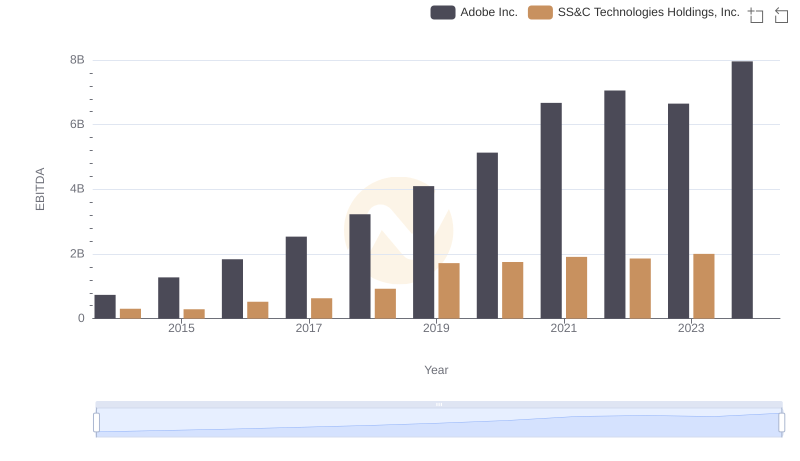
EBITDA Performance Review: Adobe Inc. vs SS&C Technologies Holdings, Inc.
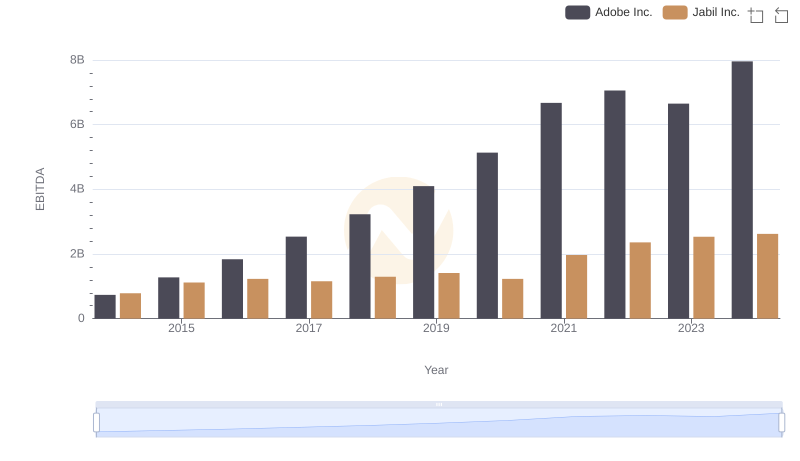
EBITDA Analysis: Evaluating Adobe Inc. Against Jabil Inc.
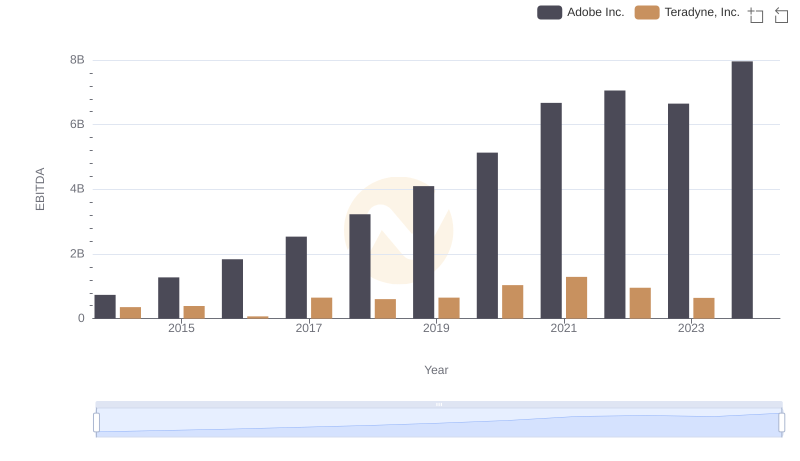
EBITDA Analysis: Evaluating Adobe Inc. Against Teradyne, Inc.
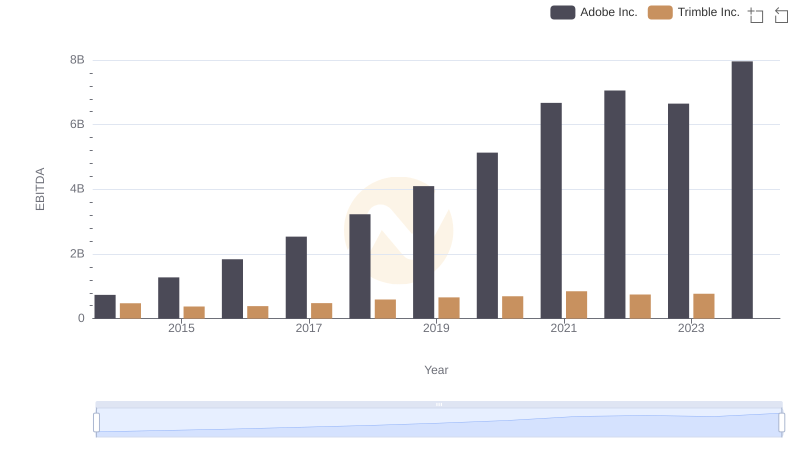
Professional EBITDA Benchmarking: Adobe Inc. vs Trimble Inc.
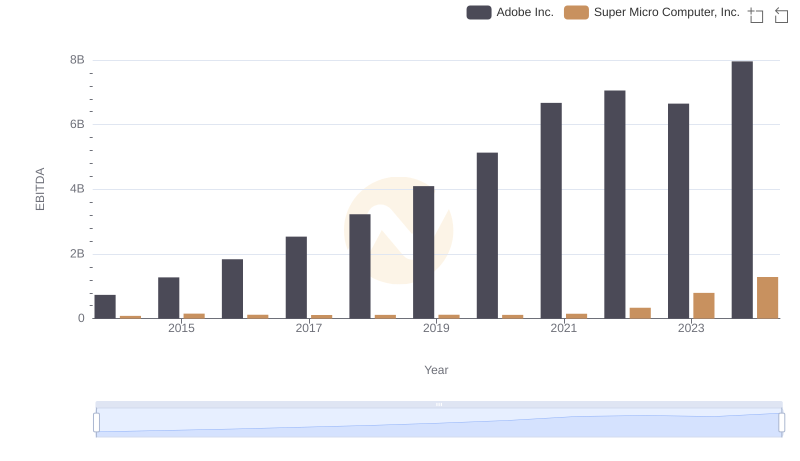
EBITDA Performance Review: Adobe Inc. vs Super Micro Computer, Inc.
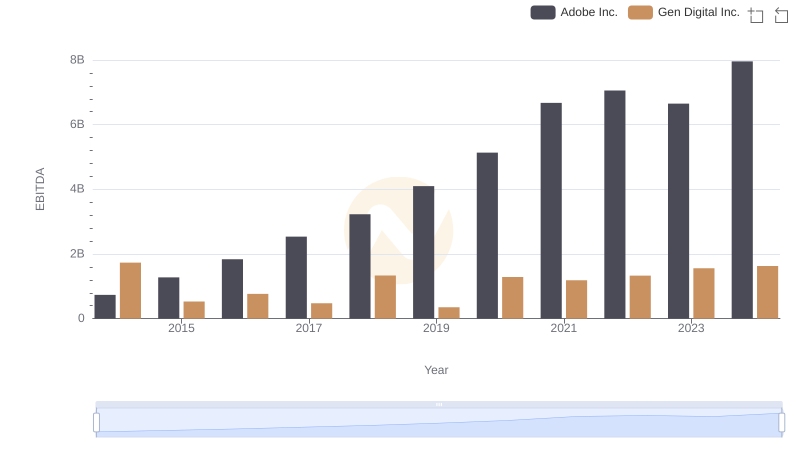
Comparative EBITDA Analysis: Adobe Inc. vs Gen Digital Inc.
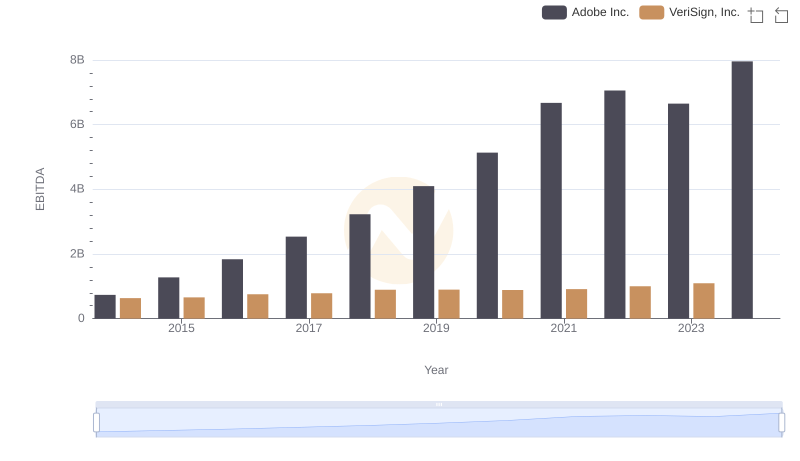
A Professional Review of EBITDA: Adobe Inc. Compared to VeriSign, Inc.