| __timestamp | Accenture plc | STMicroelectronics N.V. |
|---|---|---|
| Wednesday, January 1, 2014 | 31874678000 | 7404000000 |
| Thursday, January 1, 2015 | 32914424000 | 6897000000 |
| Friday, January 1, 2016 | 34797661000 | 6973000000 |
| Sunday, January 1, 2017 | 36765478000 | 8347000000 |
| Monday, January 1, 2018 | 41603428000 | 9664000000 |
| Tuesday, January 1, 2019 | 43215013000 | 9556000000 |
| Wednesday, January 1, 2020 | 44327039000 | 10219000000 |
| Friday, January 1, 2021 | 50533389000 | 12761000000 |
| Saturday, January 1, 2022 | 61594305000 | 16128000000 |
| Sunday, January 1, 2023 | 64111745000 | 17286000000 |
| Monday, January 1, 2024 | 64896464000 |
Unleashing insights
In the ever-evolving landscape of global technology, Accenture plc and STMicroelectronics N.V. have emerged as key players. From 2014 to 2023, Accenture's revenue has shown a robust growth trajectory, increasing by approximately 103%, from $31.9 billion to $64.1 billion. This reflects Accenture's strategic expansion and adaptability in the consulting and professional services sector. Meanwhile, STMicroelectronics, a leader in semiconductor solutions, has seen its revenue grow by about 133% over the same period, from $7.4 billion to $17.3 billion, highlighting its pivotal role in the tech hardware industry.
While Accenture's revenue consistently outpaces STMicroelectronics, the latter's growth rate is noteworthy, indicating a strong market demand for its products. The data for 2024 is incomplete, suggesting potential for further analysis. This comparison underscores the dynamic nature of the tech industry, where innovation and strategic positioning drive financial success.
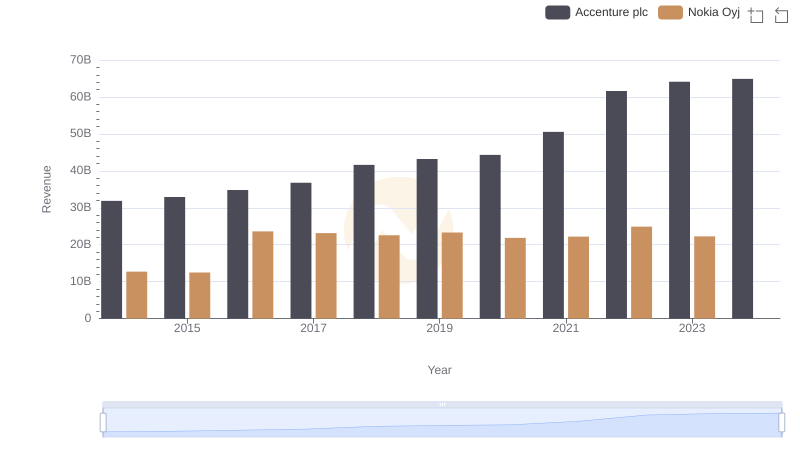
Accenture plc vs Nokia Oyj: Annual Revenue Growth Compared
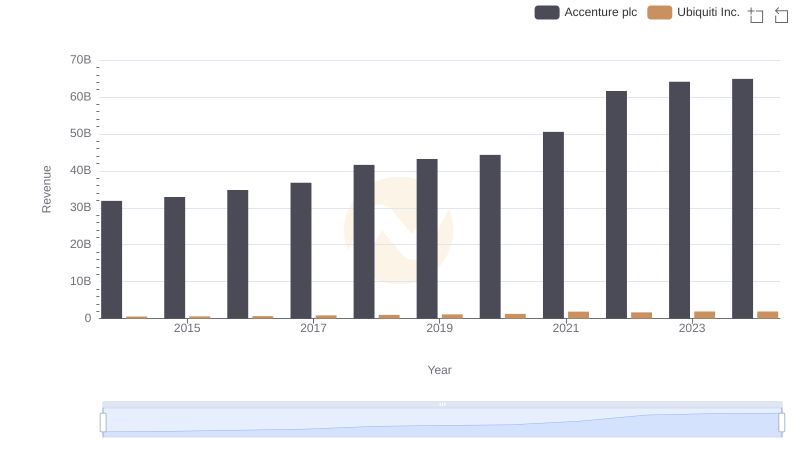
Annual Revenue Comparison: Accenture plc vs Ubiquiti Inc.
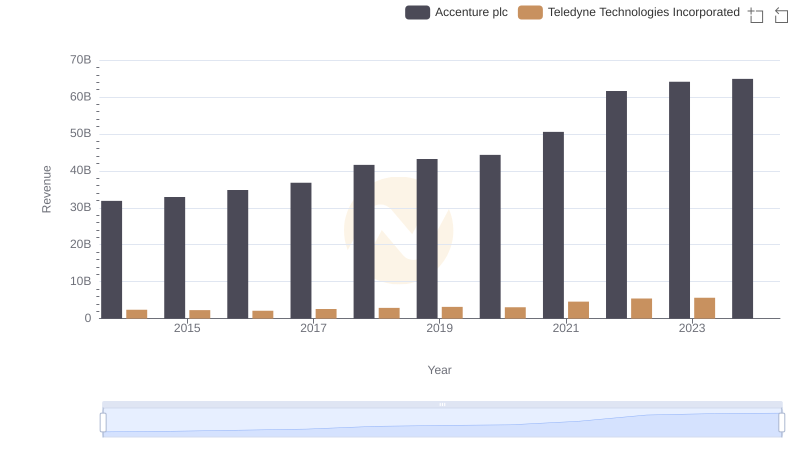
Who Generates More Revenue? Accenture plc or Teledyne Technologies Incorporated
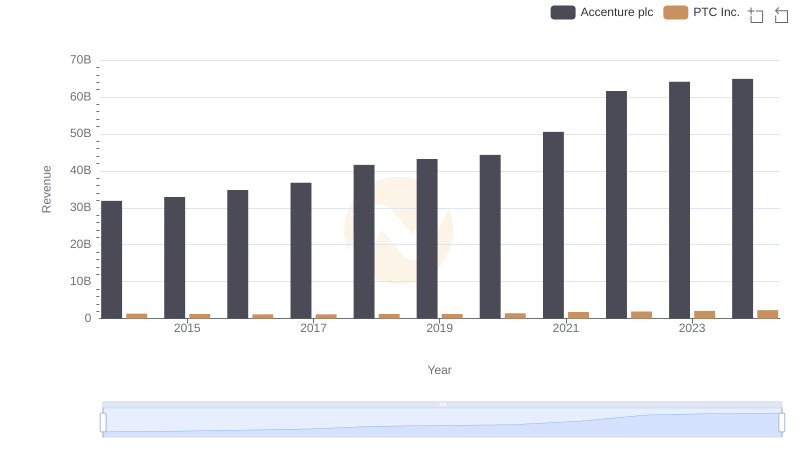
Accenture plc vs PTC Inc.: Examining Key Revenue Metrics
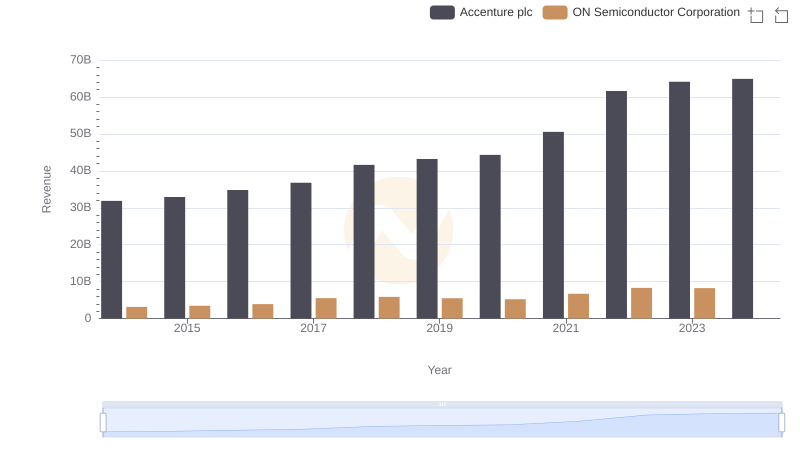
Revenue Insights: Accenture plc and ON Semiconductor Corporation Performance Compared
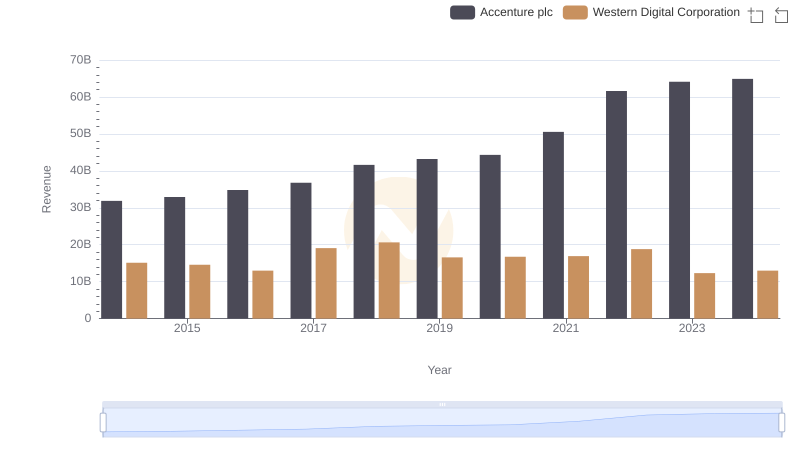
Comparing Revenue Performance: Accenture plc or Western Digital Corporation?
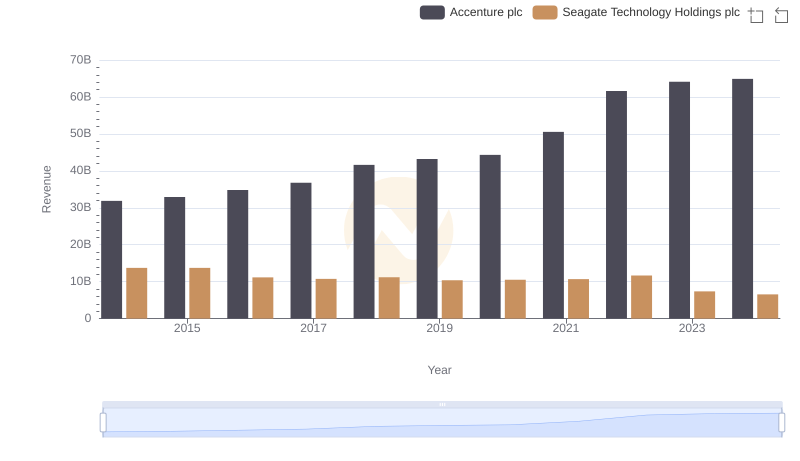
Accenture plc or Seagate Technology Holdings plc: Who Leads in Yearly Revenue?
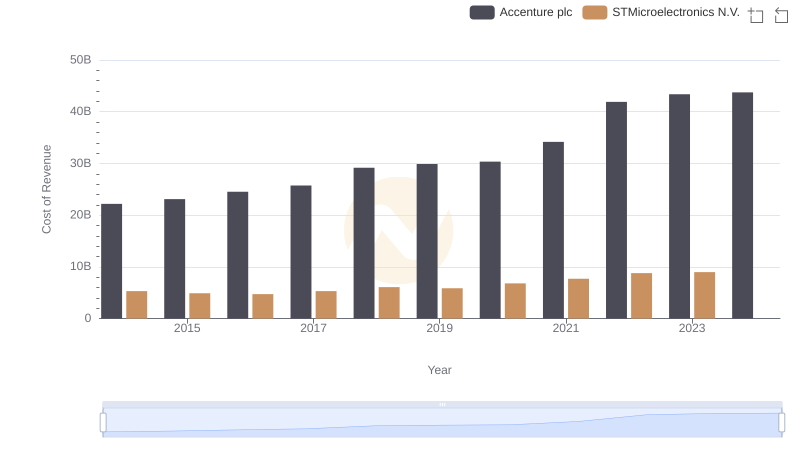
Cost Insights: Breaking Down Accenture plc and STMicroelectronics N.V.'s Expenses
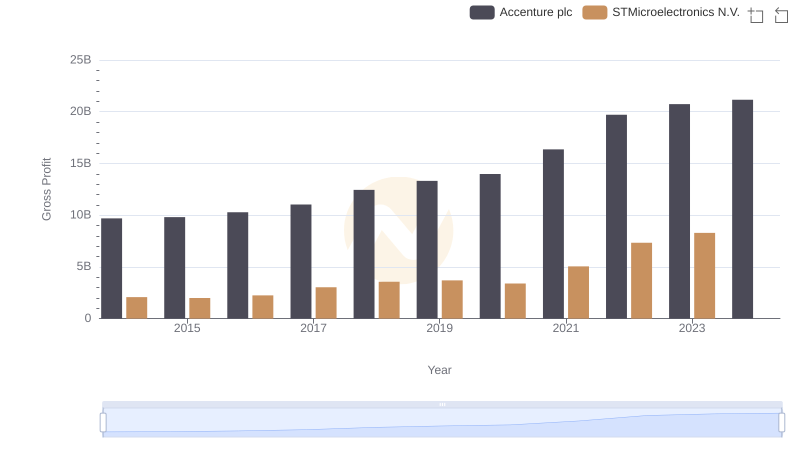
Gross Profit Analysis: Comparing Accenture plc and STMicroelectronics N.V.
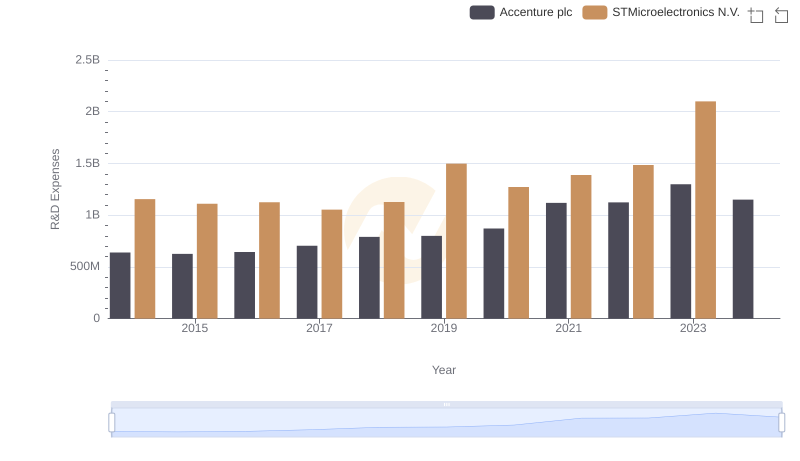
Who Prioritizes Innovation? R&D Spending Compared for Accenture plc and STMicroelectronics N.V.
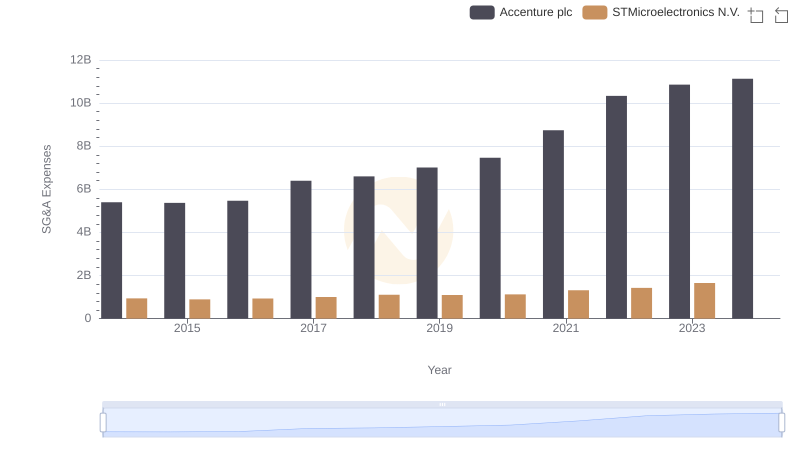
Selling, General, and Administrative Costs: Accenture plc vs STMicroelectronics N.V.
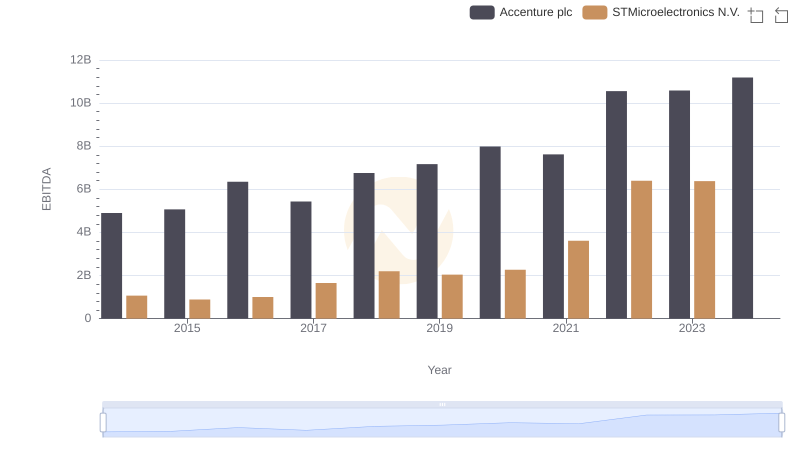
A Professional Review of EBITDA: Accenture plc Compared to STMicroelectronics N.V.