| __timestamp | Splunk Inc. | Workday, Inc. |
|---|---|---|
| Wednesday, January 1, 2014 | 75895000 | 182116000 |
| Thursday, January 1, 2015 | 150790000 | 316868000 |
| Friday, January 1, 2016 | 215309000 | 469944000 |
| Sunday, January 1, 2017 | 295850000 | 680531000 |
| Monday, January 1, 2018 | 301114000 | 910584000 |
| Tuesday, January 1, 2019 | 441969000 | 1211832000 |
| Wednesday, January 1, 2020 | 619800000 | 1549906000 |
| Friday, January 1, 2021 | 791026000 | 1721222000 |
| Saturday, January 1, 2022 | 1029574000 | 1879220000 |
| Sunday, January 1, 2023 | 997170000 | 2270660000 |
| Monday, January 1, 2024 | 918834000 | 2464000000 |
Cracking the code
In the ever-evolving tech landscape, innovation is the lifeblood of success. Workday, Inc. and Splunk Inc. exemplify this through their substantial investments in research and development (R&D) over the past decade. From 2014 to 2024, Workday, Inc. has consistently outpaced Splunk Inc. in R&D spending, with a remarkable 1,255% increase, reaching nearly $2.5 billion in 2024. In contrast, Splunk Inc. has shown a robust 1,111% growth, culminating in approximately $919 million in the same year.
This trend underscores Workday's commitment to innovation, as it has consistently allocated a larger portion of its resources to R&D. The data reveals a clear trajectory: Workday's R&D spending has grown at an average annual rate of 25%, while Splunk's has increased by 22%. This strategic focus on innovation positions both companies as leaders in their respective fields, driving technological advancements and setting industry standards.

Analyzing R&D Budgets: Apple Inc. vs Workday, Inc.
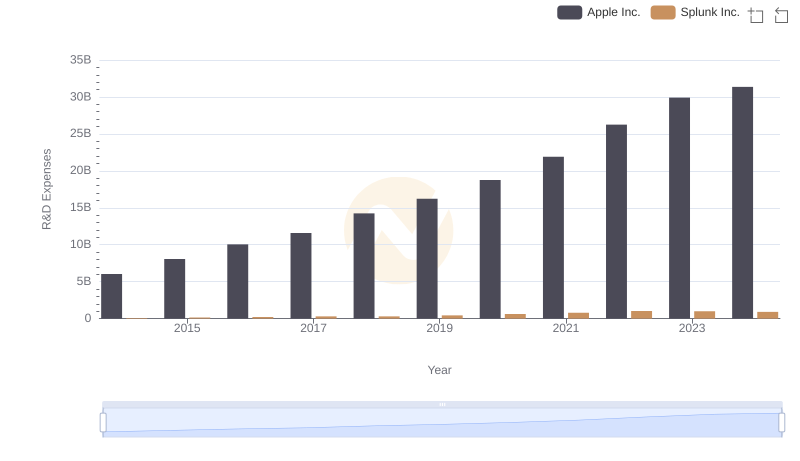
Comparing Innovation Spending: Apple Inc. and Splunk Inc.
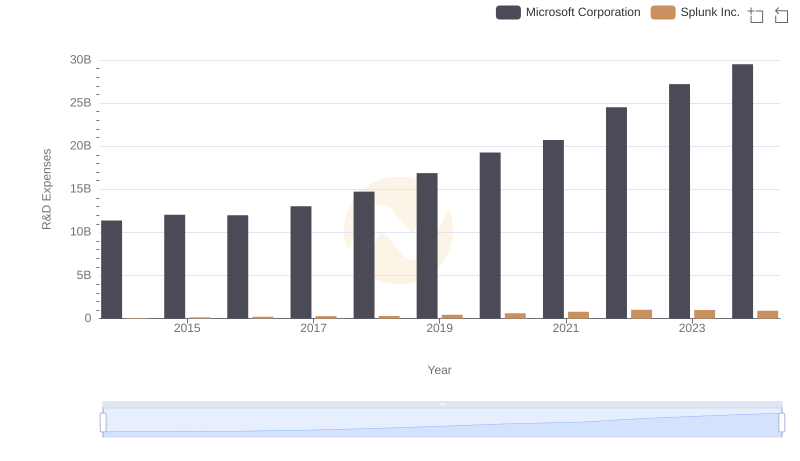
Research and Development Investment: Microsoft Corporation vs Splunk Inc.
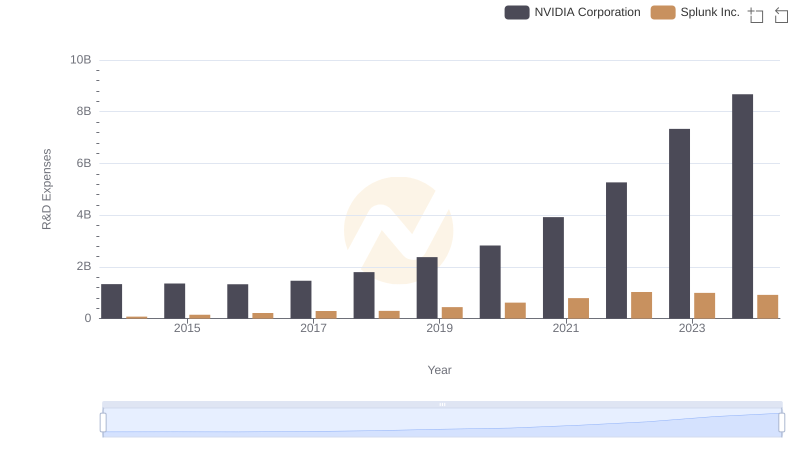
Research and Development Investment: NVIDIA Corporation vs Splunk Inc.
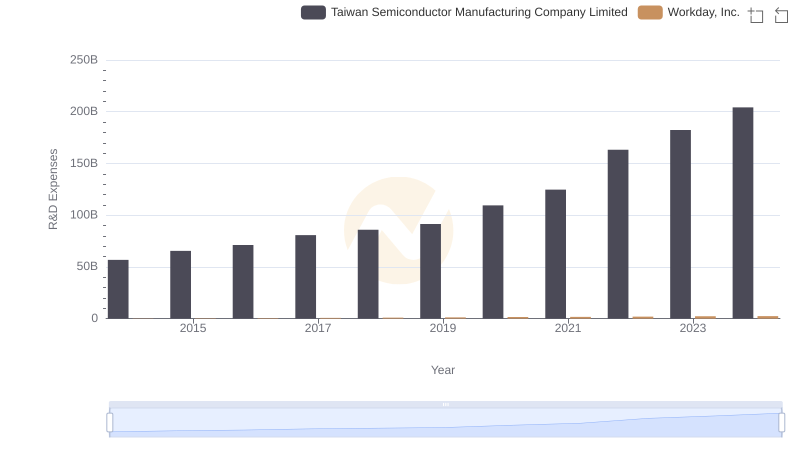
Who Prioritizes Innovation? R&D Spending Compared for Taiwan Semiconductor Manufacturing Company Limited and Workday, Inc.
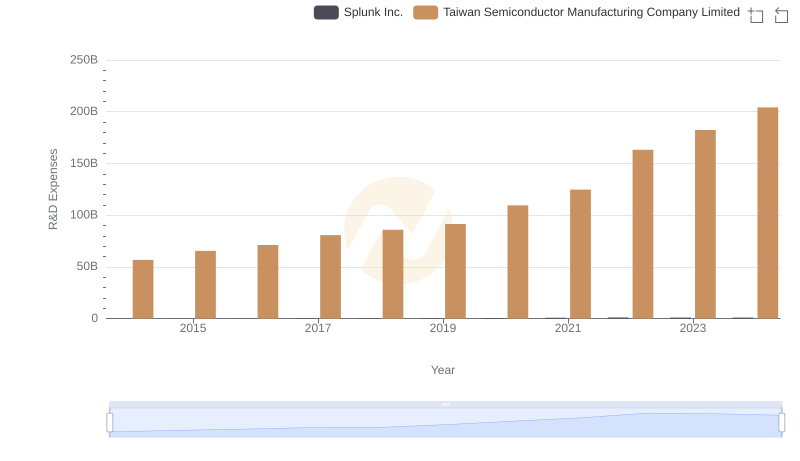
Analyzing R&D Budgets: Taiwan Semiconductor Manufacturing Company Limited vs Splunk Inc.
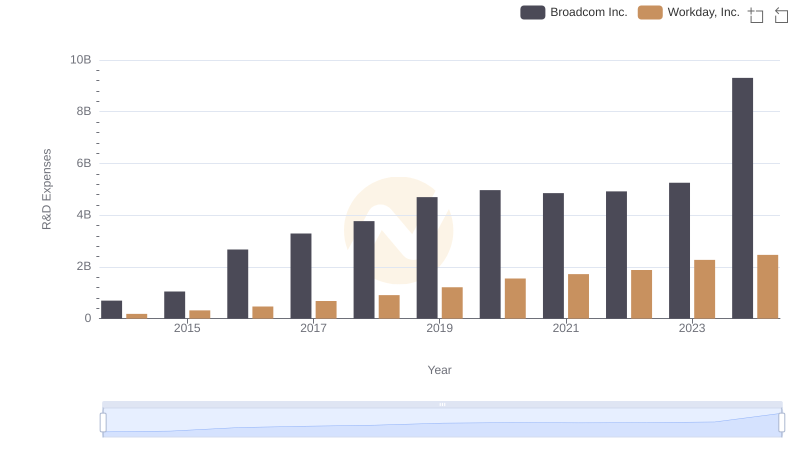
R&D Insights: How Broadcom Inc. and Workday, Inc. Allocate Funds
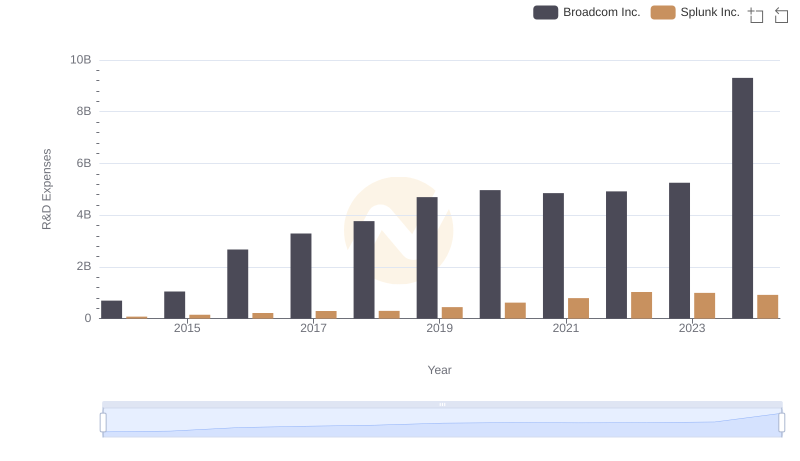
Comparing Innovation Spending: Broadcom Inc. and Splunk Inc.
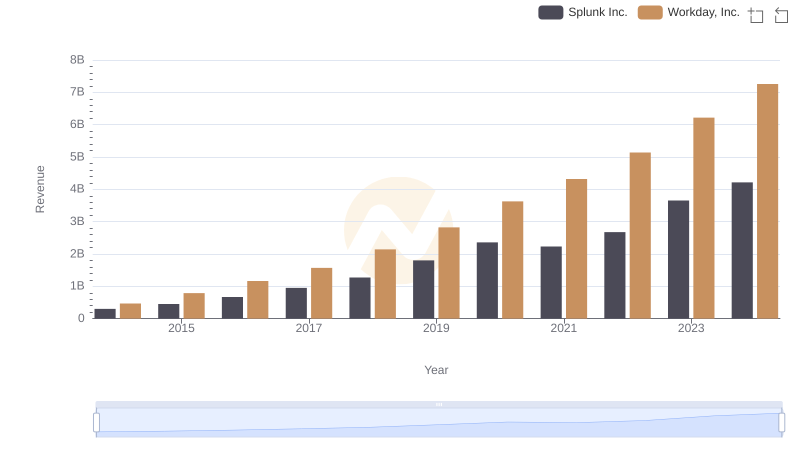
Who Generates More Revenue? Workday, Inc. or Splunk Inc.
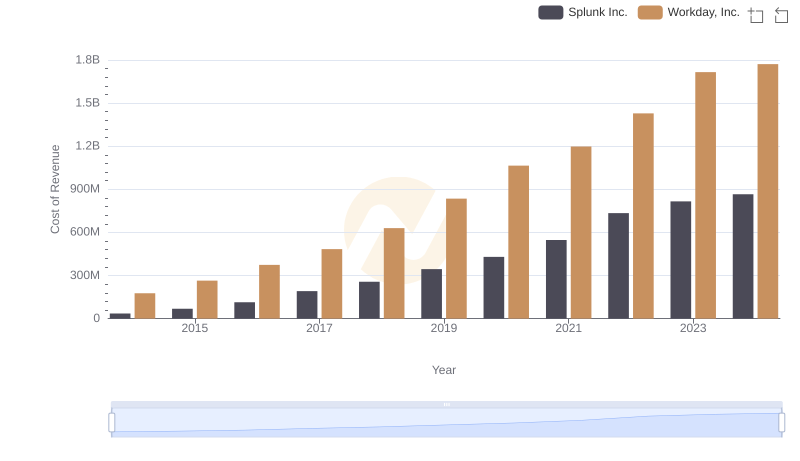
Analyzing Cost of Revenue: Workday, Inc. and Splunk Inc.
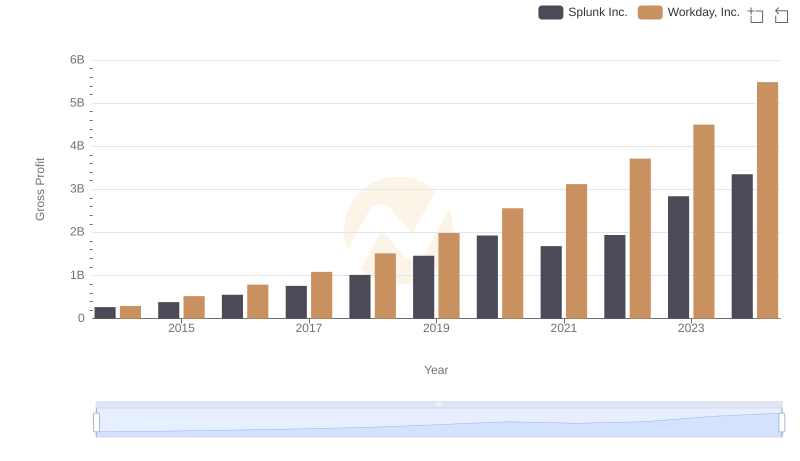
Who Generates Higher Gross Profit? Workday, Inc. or Splunk Inc.
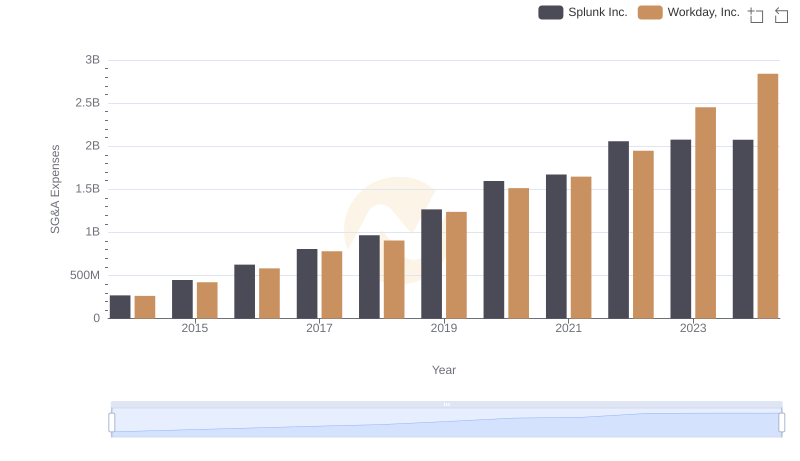
Workday, Inc. and Splunk Inc.: SG&A Spending Patterns Compared