| __timestamp | Broadridge Financial Solutions, Inc. | Shopify Inc. |
|---|---|---|
| Wednesday, January 1, 2014 | 376000000 | 57495000 |
| Thursday, January 1, 2015 | 396800000 | 89105000 |
| Friday, January 1, 2016 | 420900000 | 172324000 |
| Sunday, January 1, 2017 | 501400000 | 293413000 |
| Monday, January 1, 2018 | 565400000 | 457513000 |
| Tuesday, January 1, 2019 | 577500000 | 651775000 |
| Wednesday, January 1, 2020 | 639000000 | 847391000 |
| Friday, January 1, 2021 | 744300000 | 1276401000 |
| Saturday, January 1, 2022 | 832300000 | 1938255000 |
| Sunday, January 1, 2023 | 849000000 | 1711000000 |
| Monday, January 1, 2024 | 916800000 | 1796000000 |
Igniting the spark of knowledge
In the ever-evolving landscape of corporate finance, understanding the trends in Selling, General, and Administrative (SG&A) expenses is crucial for investors and analysts alike. Over the past decade, Shopify Inc. and Broadridge Financial Solutions, Inc. have demonstrated distinct trajectories in their SG&A expenditures. From 2014 to 2023, Broadridge's SG&A expenses have shown a steady increase, growing by approximately 144%, reflecting its consistent expansion strategy. In contrast, Shopify's SG&A expenses skyrocketed by nearly 2,900% during the same period, highlighting its aggressive growth and scaling efforts. Notably, Shopify's expenses peaked in 2022, reaching a level more than double that of Broadridge. However, 2023 saw a slight decline for Shopify, indicating potential strategic shifts or efficiency improvements. This comparative analysis underscores the dynamic nature of financial strategies in the tech and financial services sectors.
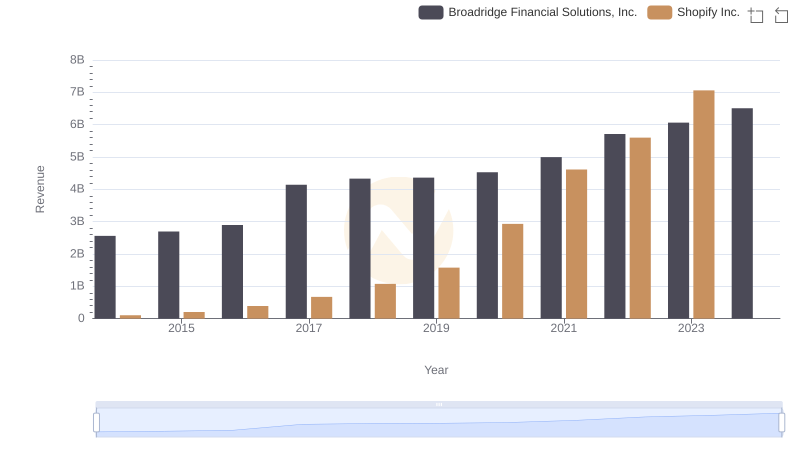
Revenue Showdown: Shopify Inc. vs Broadridge Financial Solutions, Inc.
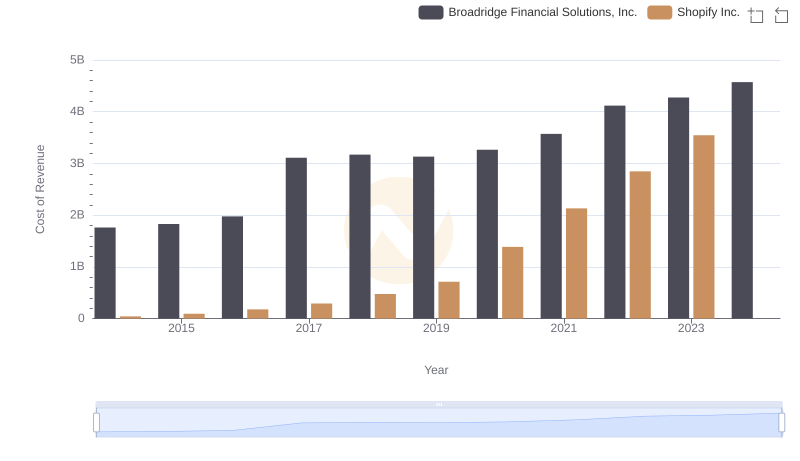
Analyzing Cost of Revenue: Shopify Inc. and Broadridge Financial Solutions, Inc.
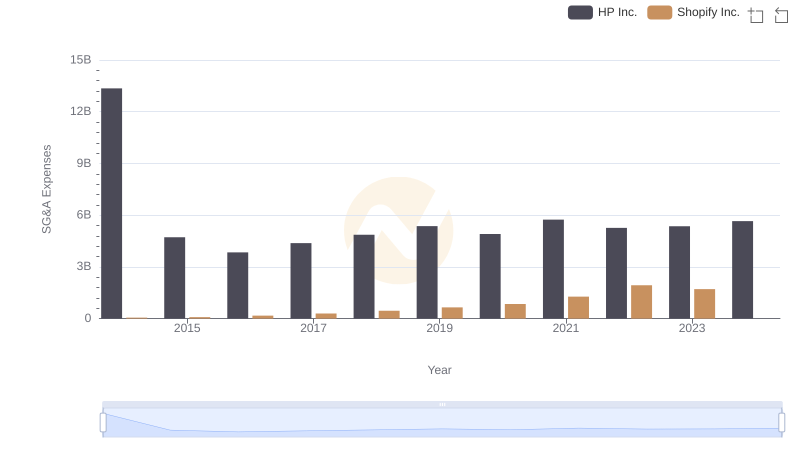
Breaking Down SG&A Expenses: Shopify Inc. vs HP Inc.
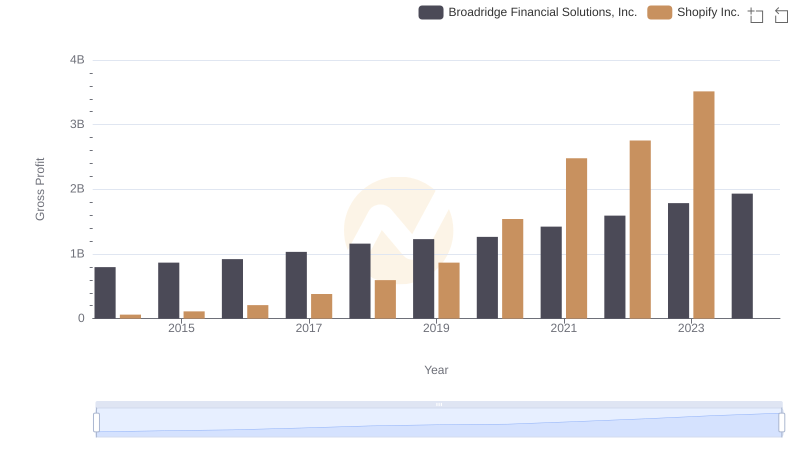
Gross Profit Analysis: Comparing Shopify Inc. and Broadridge Financial Solutions, Inc.
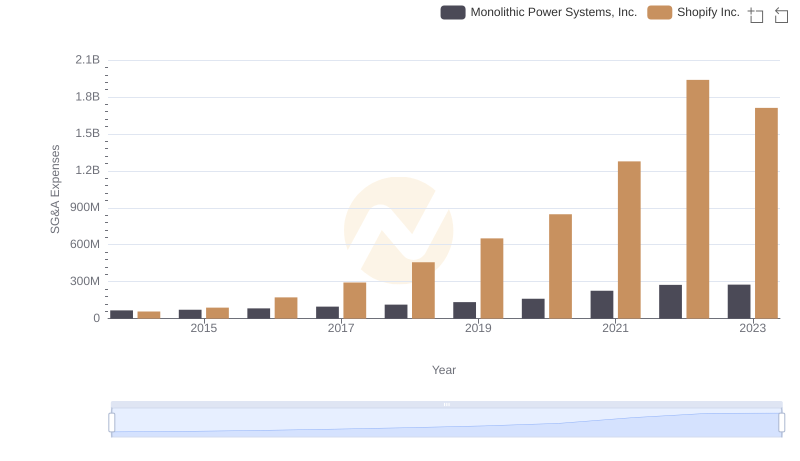
Selling, General, and Administrative Costs: Shopify Inc. vs Monolithic Power Systems, Inc.
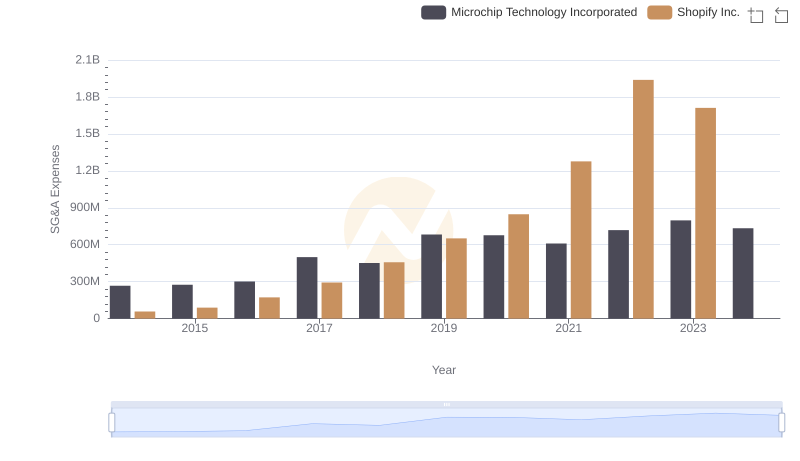
Shopify Inc. vs Microchip Technology Incorporated: SG&A Expense Trends
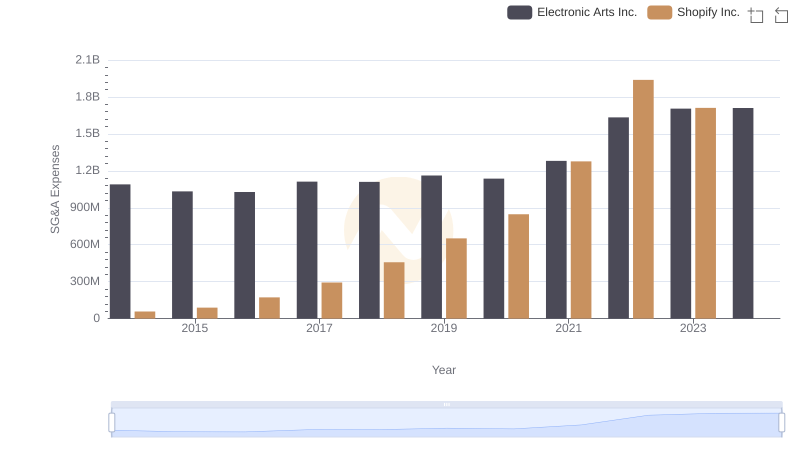
Comparing SG&A Expenses: Shopify Inc. vs Electronic Arts Inc. Trends and Insights
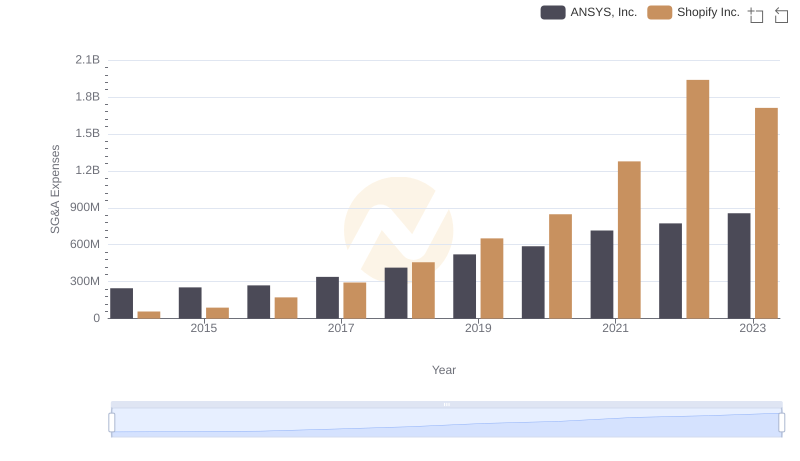
Shopify Inc. and ANSYS, Inc.: SG&A Spending Patterns Compared
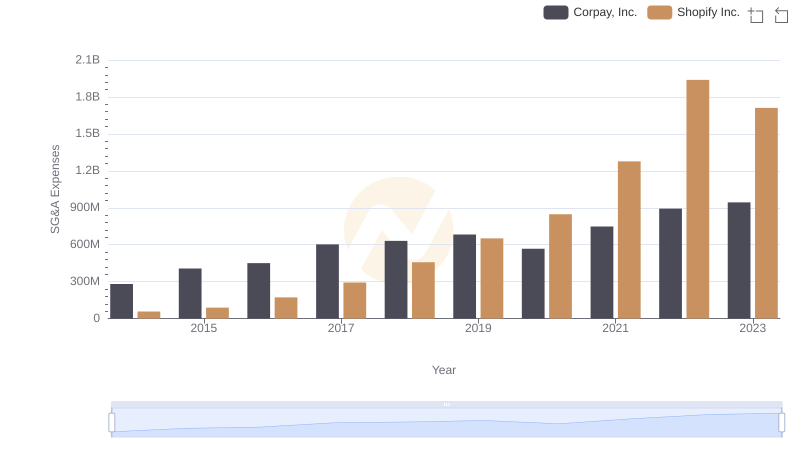
Comparing SG&A Expenses: Shopify Inc. vs Corpay, Inc. Trends and Insights
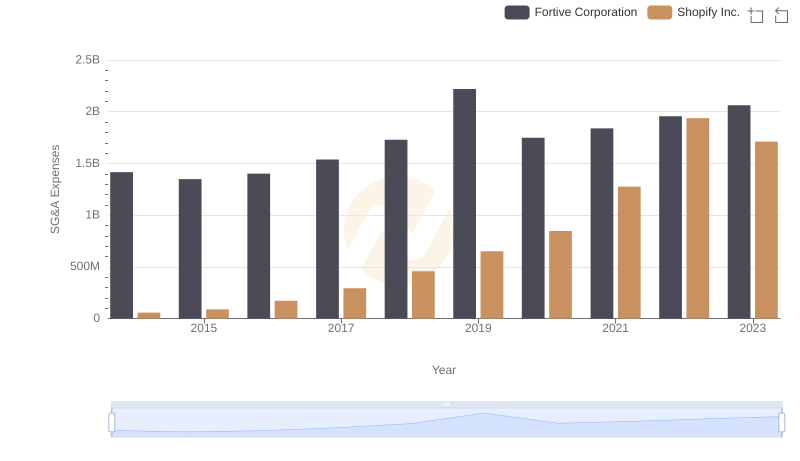
Shopify Inc. or Fortive Corporation: Who Manages SG&A Costs Better?
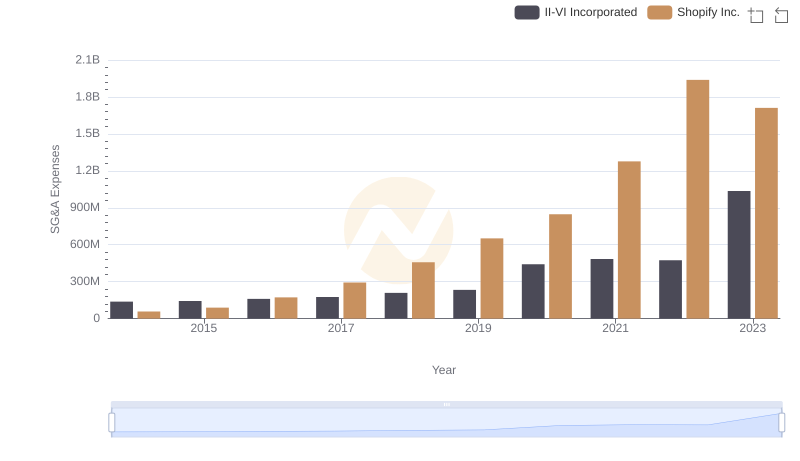
Shopify Inc. and II-VI Incorporated: SG&A Spending Patterns Compared
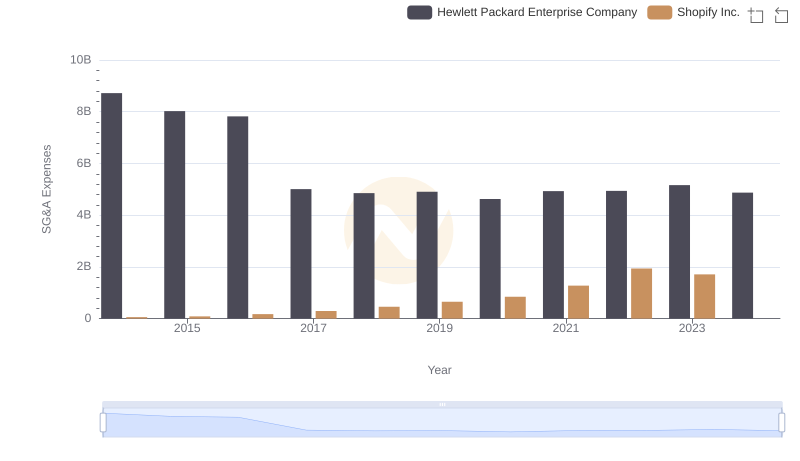
Selling, General, and Administrative Costs: Shopify Inc. vs Hewlett Packard Enterprise Company