| __timestamp | Gen Digital Inc. | Shopify Inc. |
|---|---|---|
| Wednesday, January 1, 2014 | 2880000000 | 57495000 |
| Thursday, January 1, 2015 | 2702000000 | 89105000 |
| Friday, January 1, 2016 | 1587000000 | 172324000 |
| Sunday, January 1, 2017 | 2023000000 | 293413000 |
| Monday, January 1, 2018 | 2171000000 | 457513000 |
| Tuesday, January 1, 2019 | 1940000000 | 651775000 |
| Wednesday, January 1, 2020 | 1069000000 | 847391000 |
| Friday, January 1, 2021 | 791000000 | 1276401000 |
| Saturday, January 1, 2022 | 1014000000 | 1938255000 |
| Sunday, January 1, 2023 | 968000000 | 1711000000 |
| Monday, January 1, 2024 | 1337000000 | 1796000000 |
Data in motion
In the ever-evolving landscape of corporate finance, understanding a company's spending patterns can offer valuable insights into its strategic priorities. Over the past decade, Shopify Inc. and Gen Digital Inc. have showcased contrasting approaches in their Selling, General, and Administrative (SG&A) expenses.
From 2014 to 2023, Gen Digital Inc. consistently allocated a significant portion of its budget to SG&A, peaking in 2014 with expenditures nearly 50 times that of Shopify. However, Shopify's SG&A spending has grown exponentially, increasing by over 3,200% from 2014 to 2022, reflecting its aggressive expansion strategy. By 2022, Shopify's SG&A expenses surpassed Gen Digital's, marking a pivotal shift in spending dynamics.
This data highlights the strategic shifts within these companies, with Shopify's rapid growth trajectory contrasting with Gen Digital's more stable expenditure pattern. Missing data for 2024 suggests ongoing changes, warranting close observation.
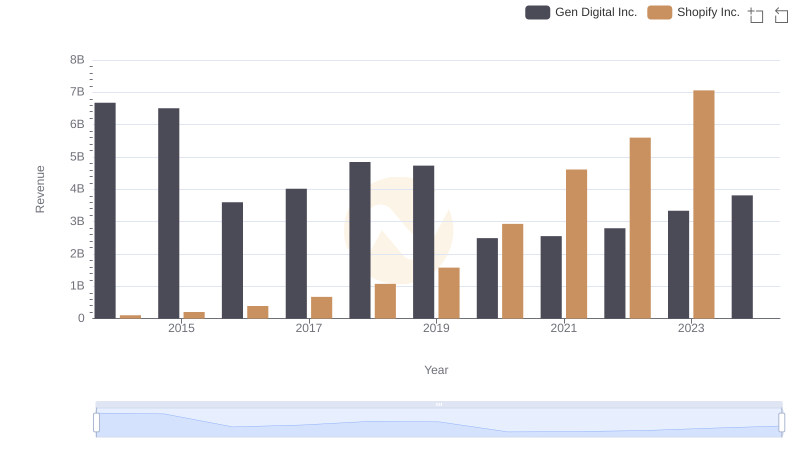
Shopify Inc. vs Gen Digital Inc.: Examining Key Revenue Metrics
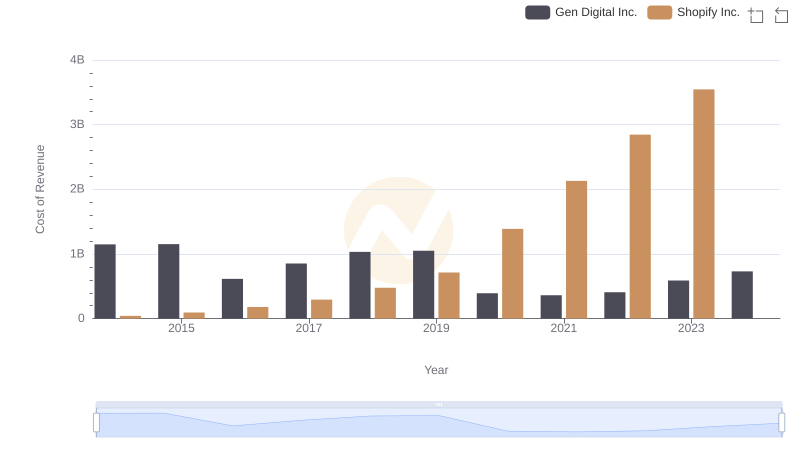
Cost Insights: Breaking Down Shopify Inc. and Gen Digital Inc.'s Expenses
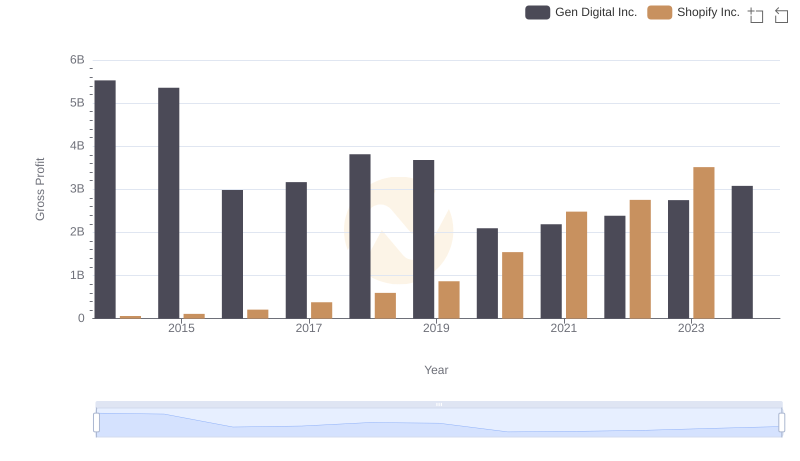
Gross Profit Analysis: Comparing Shopify Inc. and Gen Digital Inc.
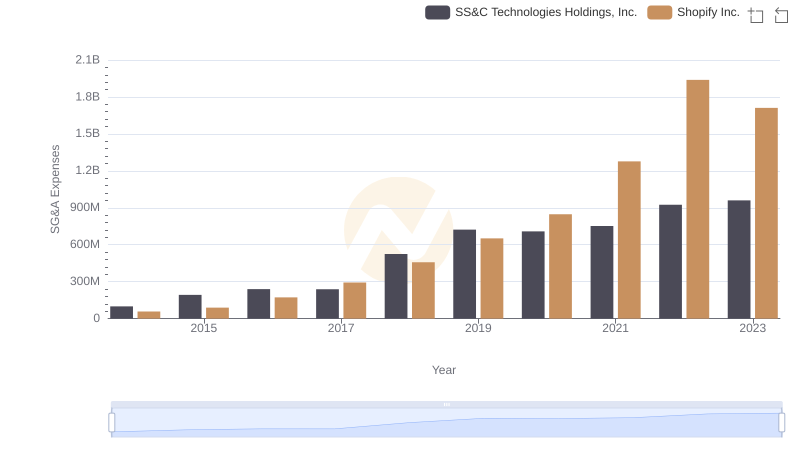
Comparing SG&A Expenses: Shopify Inc. vs SS&C Technologies Holdings, Inc. Trends and Insights
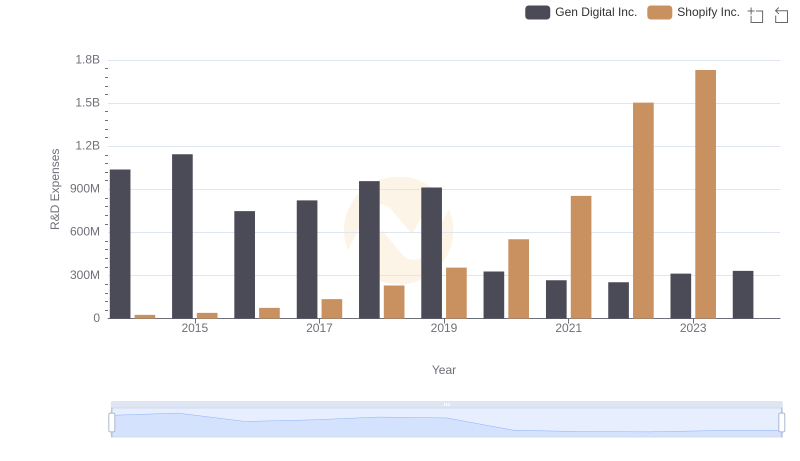
R&D Insights: How Shopify Inc. and Gen Digital Inc. Allocate Funds
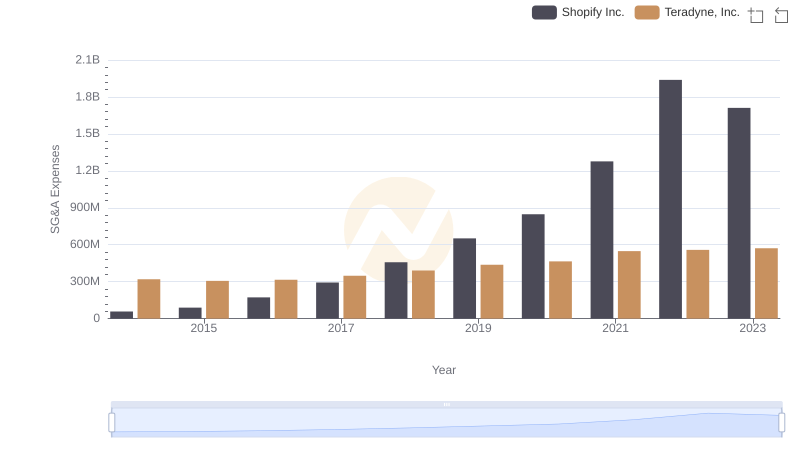
Shopify Inc. and Teradyne, Inc.: SG&A Spending Patterns Compared
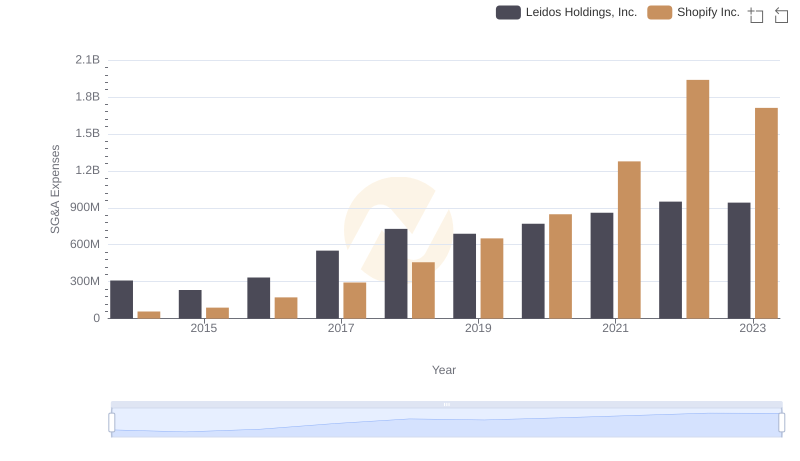
SG&A Efficiency Analysis: Comparing Shopify Inc. and Leidos Holdings, Inc.
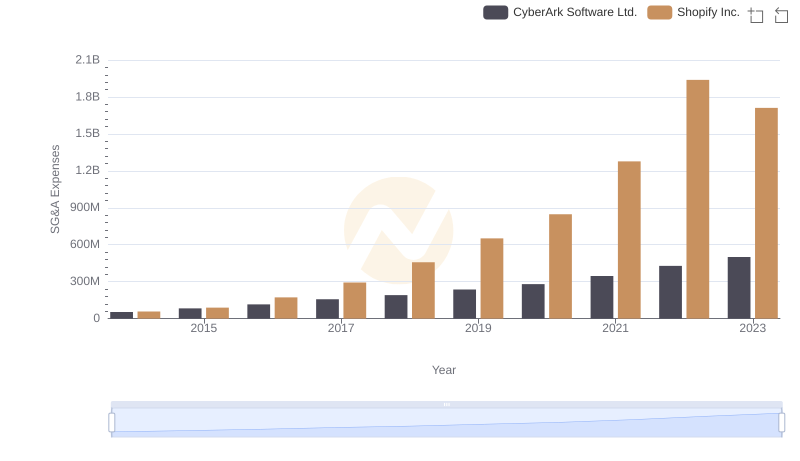
Who Optimizes SG&A Costs Better? Shopify Inc. or CyberArk Software Ltd.
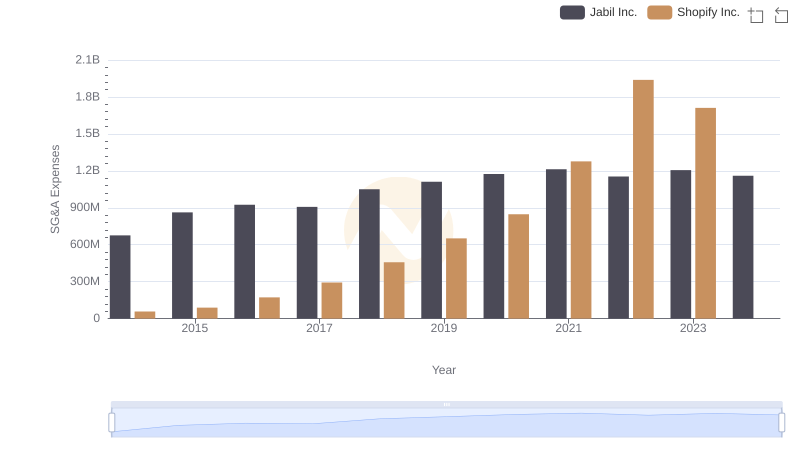
Breaking Down SG&A Expenses: Shopify Inc. vs Jabil Inc.
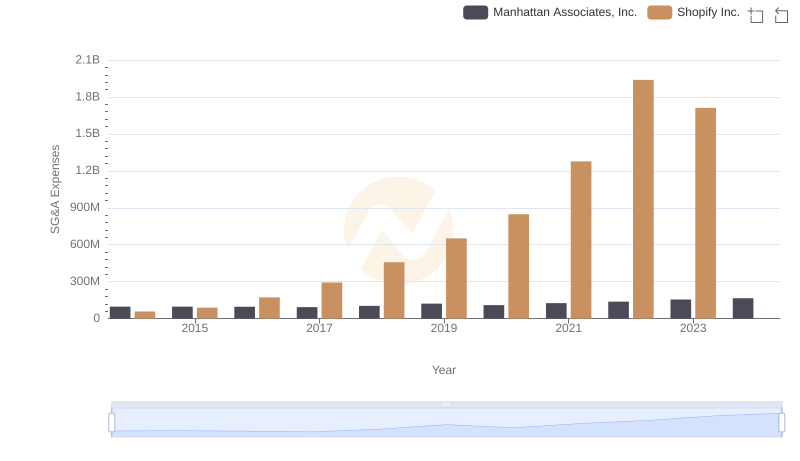
Shopify Inc. or Manhattan Associates, Inc.: Who Manages SG&A Costs Better?
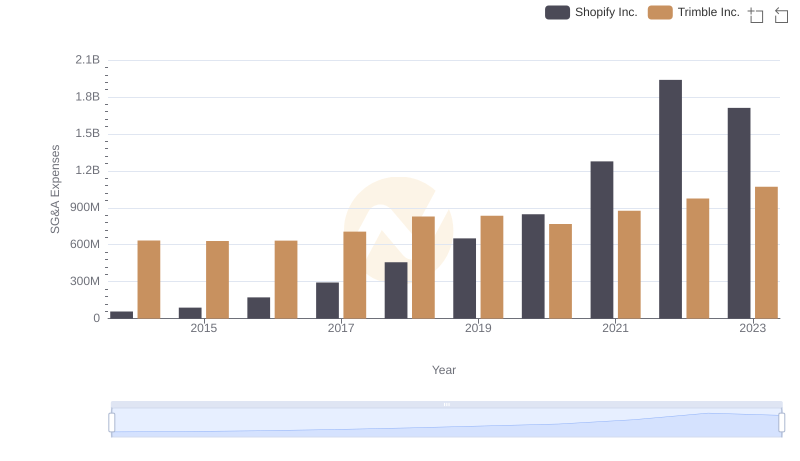
Selling, General, and Administrative Costs: Shopify Inc. vs Trimble Inc.
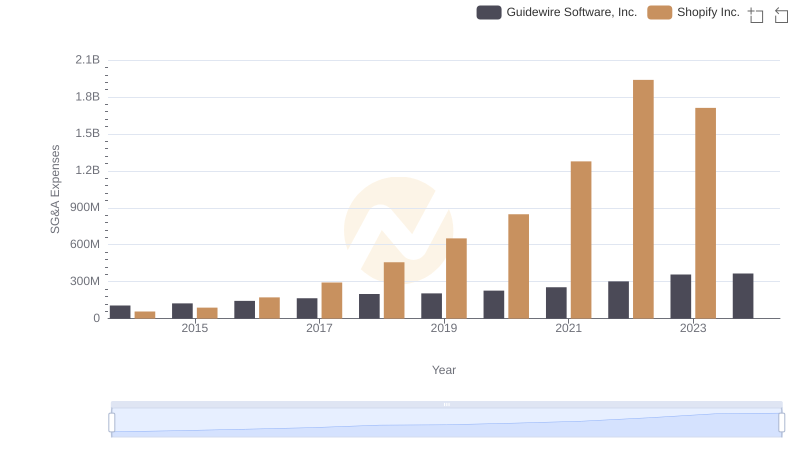
Shopify Inc. or Guidewire Software, Inc.: Who Manages SG&A Costs Better?