| __timestamp | Fortinet, Inc. | Wipro Limited |
|---|---|---|
| Wednesday, January 1, 2014 | 357151000 | 54144000000 |
| Thursday, January 1, 2015 | 541885000 | 59142000000 |
| Friday, January 1, 2016 | 707581000 | 64514000000 |
| Sunday, January 1, 2017 | 788888000 | 76490000000 |
| Monday, January 1, 2018 | 875300000 | 80461000000 |
| Tuesday, January 1, 2019 | 1029000000 | 72730000000 |
| Wednesday, January 1, 2020 | 1191400000 | 76086000000 |
| Friday, January 1, 2021 | 1489200000 | 93805000000 |
| Saturday, January 1, 2022 | 1855100000 | 114803000000 |
| Sunday, January 1, 2023 | 2217300000 | 119755000000 |
| Monday, January 1, 2024 | 2282600000 | 127509000000 |
Unveiling the hidden dimensions of data
In the ever-evolving landscape of global technology, Fortinet, Inc. and Wipro Limited stand as titans, each with a unique approach to managing Selling, General, and Administrative (SG&A) expenses. Over the past decade, Fortinet has seen a remarkable increase in SG&A expenses, growing by over 520% from 2014 to 2023. This reflects its aggressive expansion strategy and investment in market penetration. In contrast, Wipro Limited, a stalwart in the IT services sector, has maintained a steady growth in SG&A expenses, with a 121% increase over the same period. This stability underscores Wipro's focus on operational efficiency and cost management. Notably, 2024 data for Fortinet is missing, highlighting potential data gaps in financial reporting. As these companies continue to navigate the complexities of the global market, their SG&A strategies will be pivotal in shaping their competitive edge.
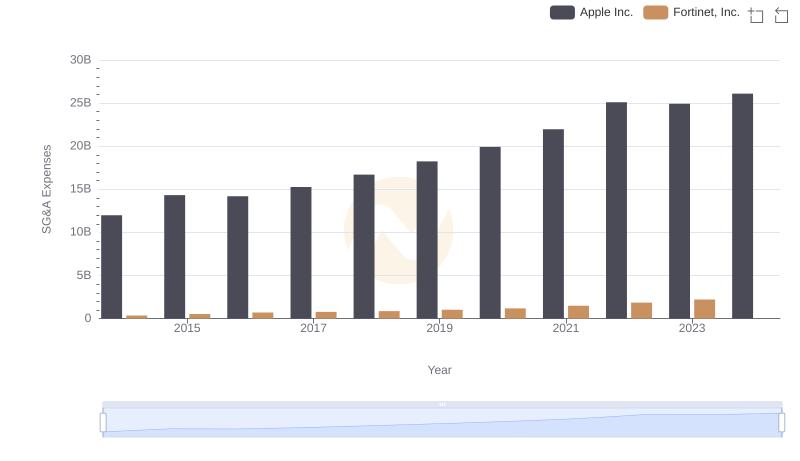
Apple Inc. and Fortinet, Inc.: SG&A Spending Patterns Compared
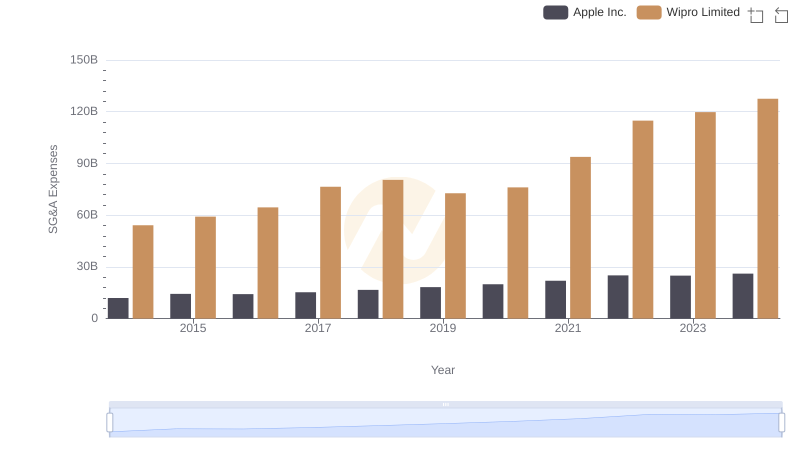
Comparing SG&A Expenses: Apple Inc. vs Wipro Limited Trends and Insights
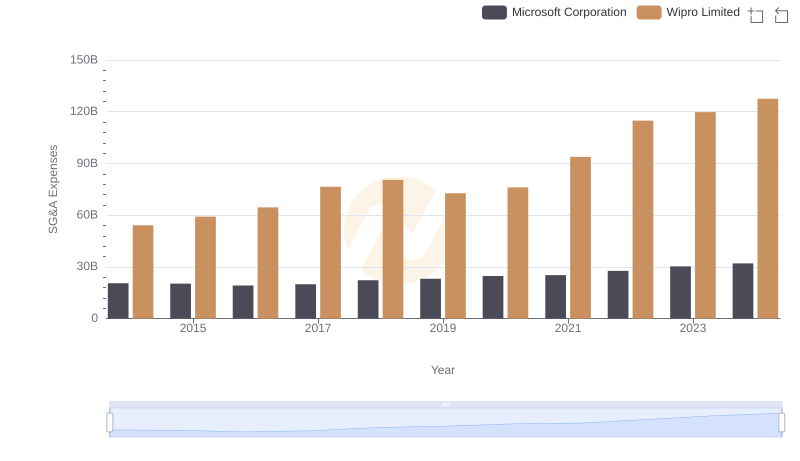
Cost Management Insights: SG&A Expenses for Microsoft Corporation and Wipro Limited
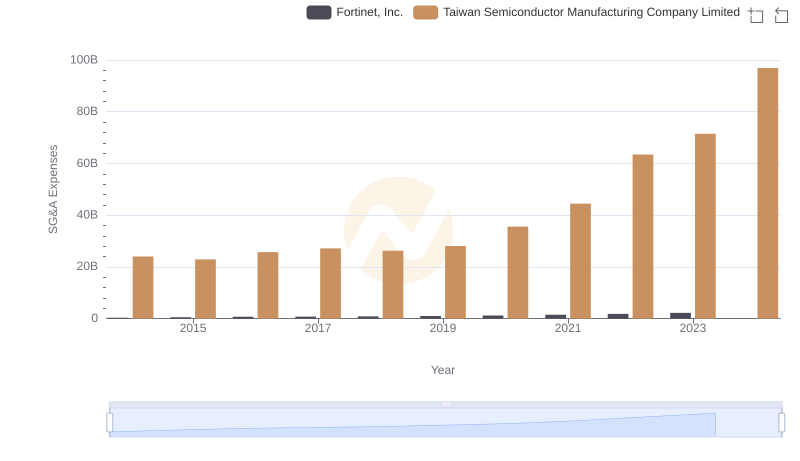
Who Optimizes SG&A Costs Better? Taiwan Semiconductor Manufacturing Company Limited or Fortinet, Inc.
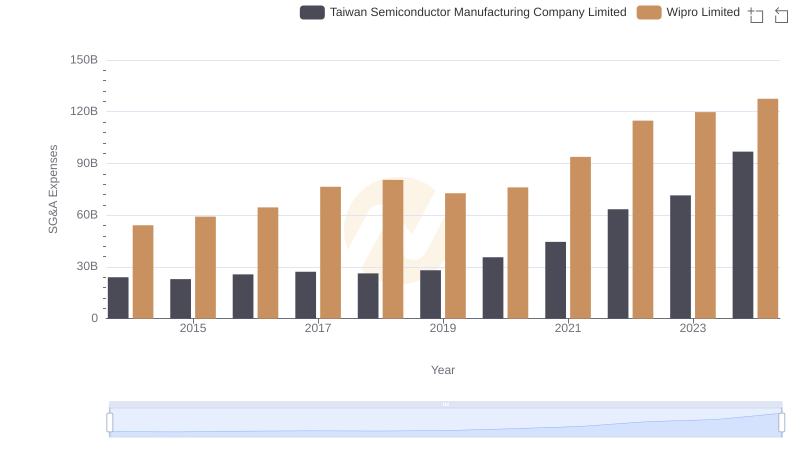
Taiwan Semiconductor Manufacturing Company Limited and Wipro Limited: SG&A Spending Patterns Compared
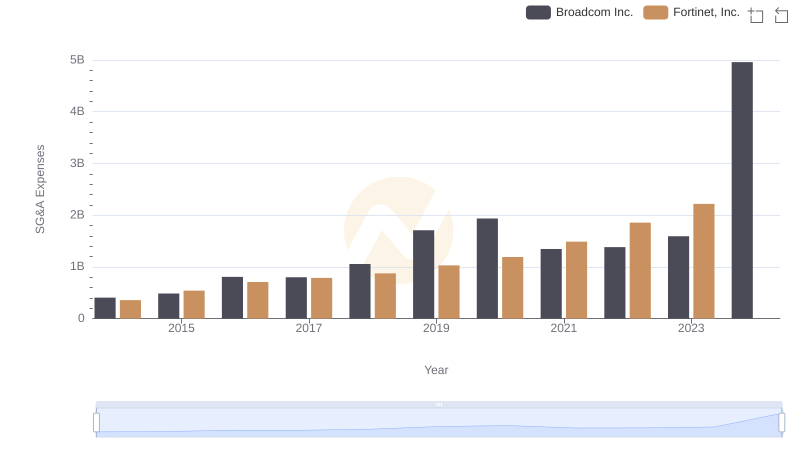
Breaking Down SG&A Expenses: Broadcom Inc. vs Fortinet, Inc.
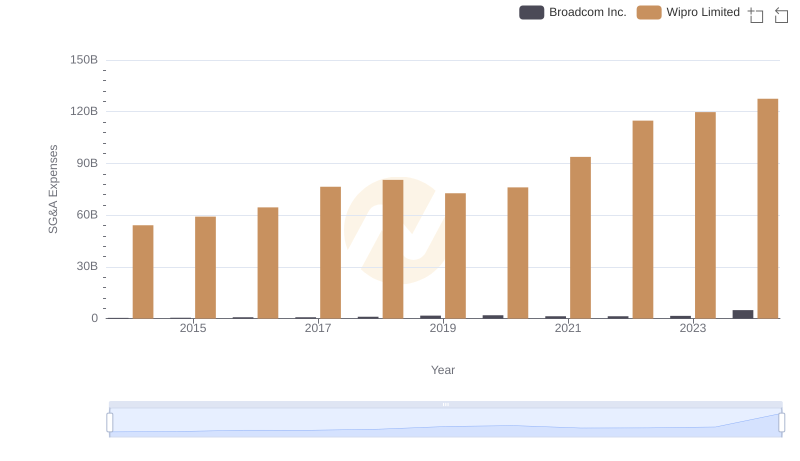
SG&A Efficiency Analysis: Comparing Broadcom Inc. and Wipro Limited
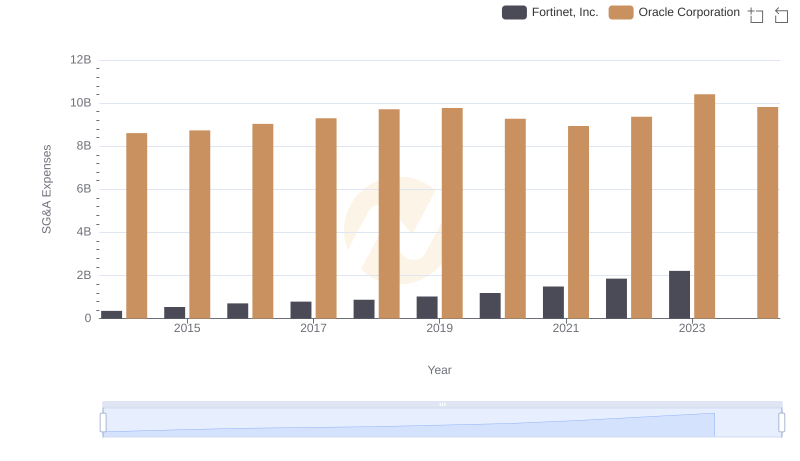
SG&A Efficiency Analysis: Comparing Oracle Corporation and Fortinet, Inc.
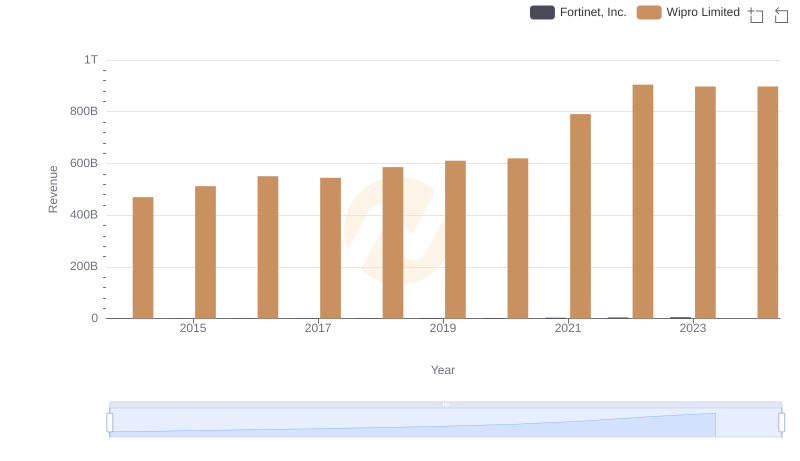
Fortinet, Inc. and Wipro Limited: A Comprehensive Revenue Analysis
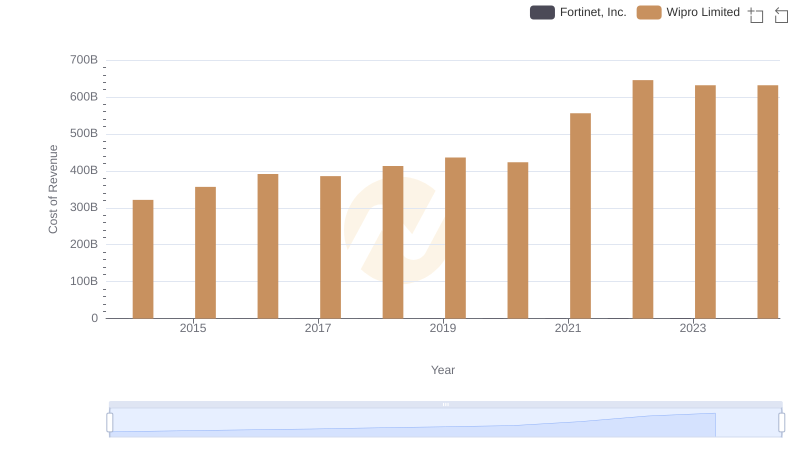
Fortinet, Inc. vs Wipro Limited: Efficiency in Cost of Revenue Explored
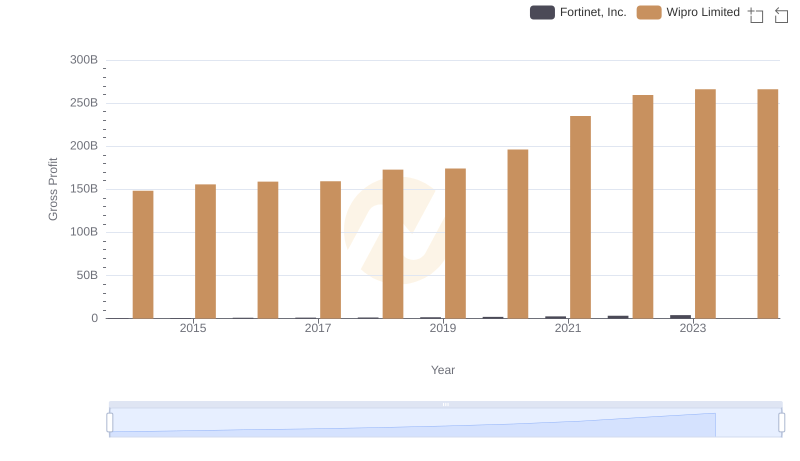
Gross Profit Analysis: Comparing Fortinet, Inc. and Wipro Limited
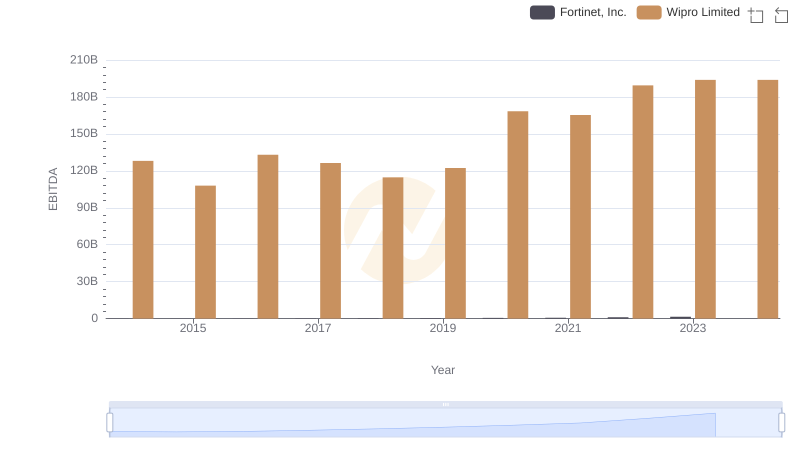
A Side-by-Side Analysis of EBITDA: Fortinet, Inc. and Wipro Limited