| __timestamp | Carlisle Companies Incorporated | Owens Corning |
|---|---|---|
| Wednesday, January 1, 2014 | 379000000 | 487000000 |
| Thursday, January 1, 2015 | 461900000 | 525000000 |
| Friday, January 1, 2016 | 532000000 | 584000000 |
| Sunday, January 1, 2017 | 589400000 | 620000000 |
| Monday, January 1, 2018 | 625400000 | 700000000 |
| Tuesday, January 1, 2019 | 667100000 | 698000000 |
| Wednesday, January 1, 2020 | 603200000 | 664000000 |
| Friday, January 1, 2021 | 698200000 | 757000000 |
| Saturday, January 1, 2022 | 811500000 | 803000000 |
| Sunday, January 1, 2023 | 625200000 | 831000000 |
| Monday, January 1, 2024 | 722800000 |
Unleashing the power of data
In the competitive landscape of industrial manufacturing, understanding the efficiency of Selling, General, and Administrative (SG&A) expenses is crucial. Over the past decade, Carlisle Companies Incorporated and Owens Corning have demonstrated distinct trajectories in their SG&A spending. From 2014 to 2023, Owens Corning consistently outpaced Carlisle in SG&A expenses, peaking in 2023 with a 71% increase from 2014. Meanwhile, Carlisle's SG&A expenses saw a more modest rise of 65% over the same period. Notably, 2022 marked a pivotal year where Carlisle's expenses surged by 35% compared to the previous year, surpassing Owens Corning for the first time. This shift highlights Carlisle's strategic investments in operational efficiency. As these industry leaders continue to evolve, monitoring their SG&A trends offers valuable insights into their financial health and strategic priorities.
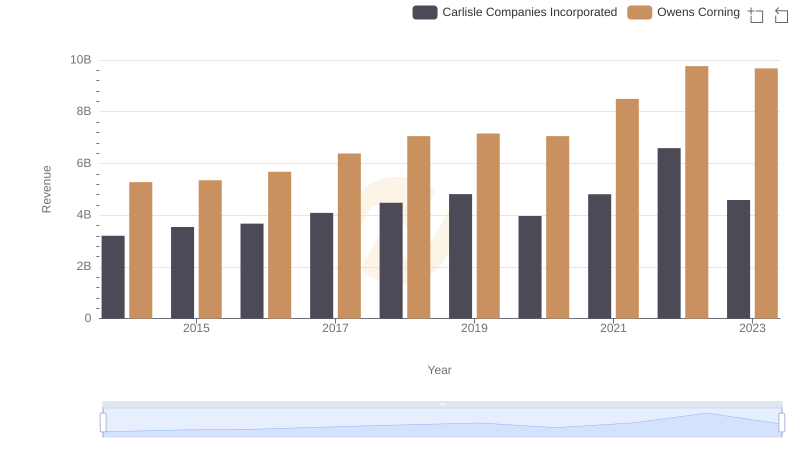
Carlisle Companies Incorporated vs Owens Corning: Annual Revenue Growth Compared
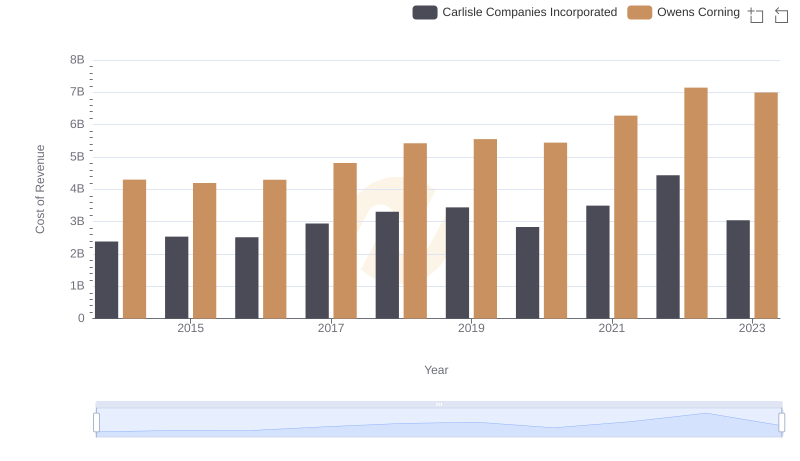
Cost of Revenue Trends: Carlisle Companies Incorporated vs Owens Corning
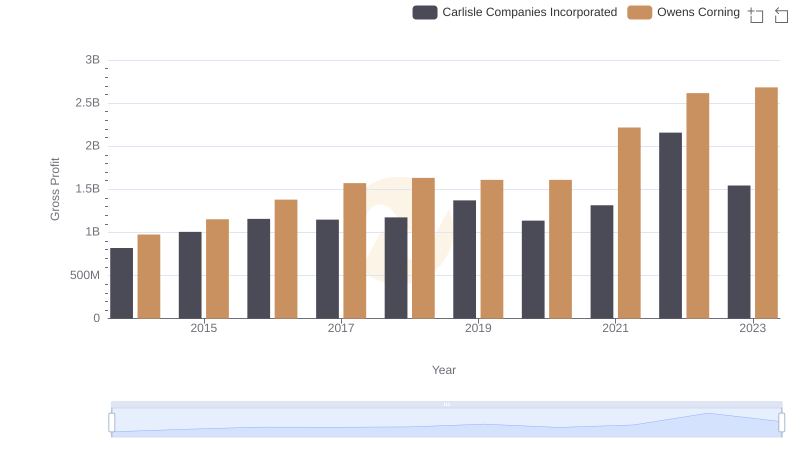
Gross Profit Comparison: Carlisle Companies Incorporated and Owens Corning Trends
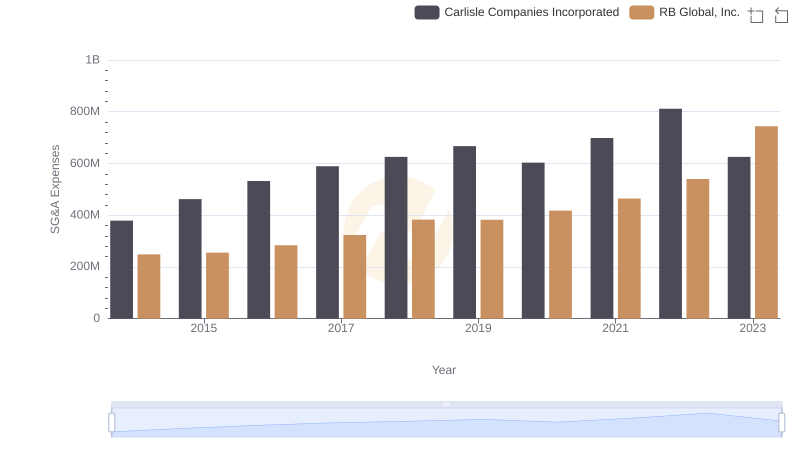
Selling, General, and Administrative Costs: Carlisle Companies Incorporated vs RB Global, Inc.
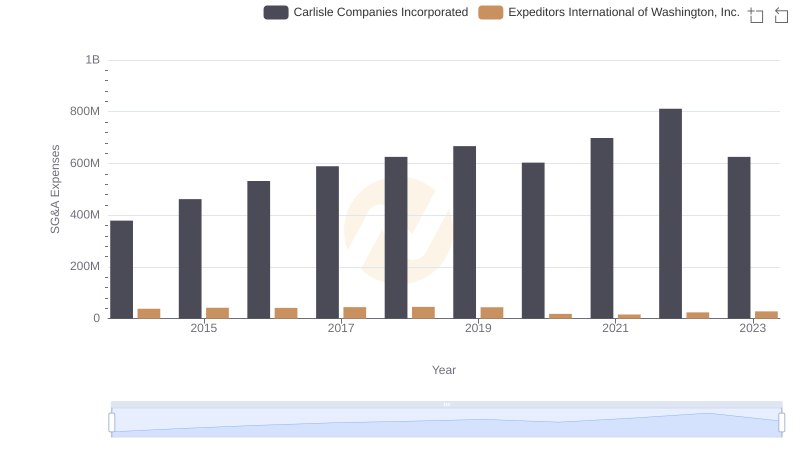
Comparing SG&A Expenses: Carlisle Companies Incorporated vs Expeditors International of Washington, Inc. Trends and Insights
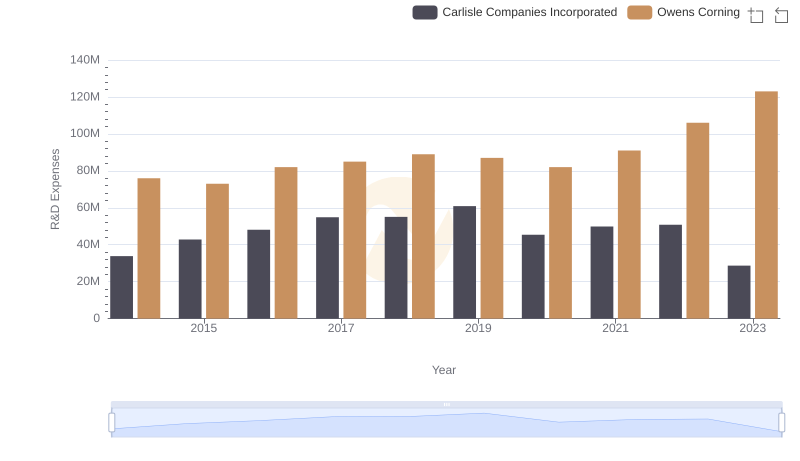
Analyzing R&D Budgets: Carlisle Companies Incorporated vs Owens Corning
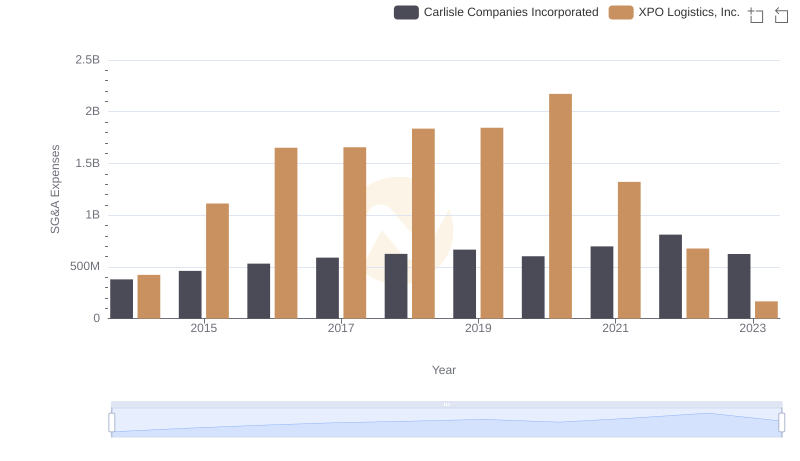
Carlisle Companies Incorporated and XPO Logistics, Inc.: SG&A Spending Patterns Compared
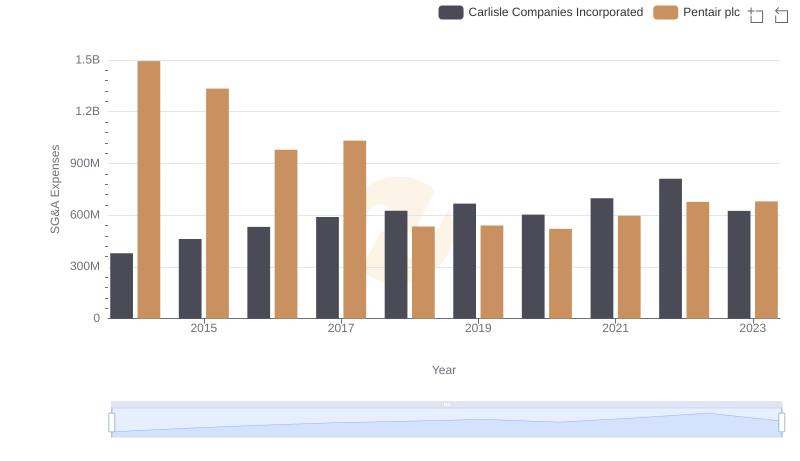
Cost Management Insights: SG&A Expenses for Carlisle Companies Incorporated and Pentair plc
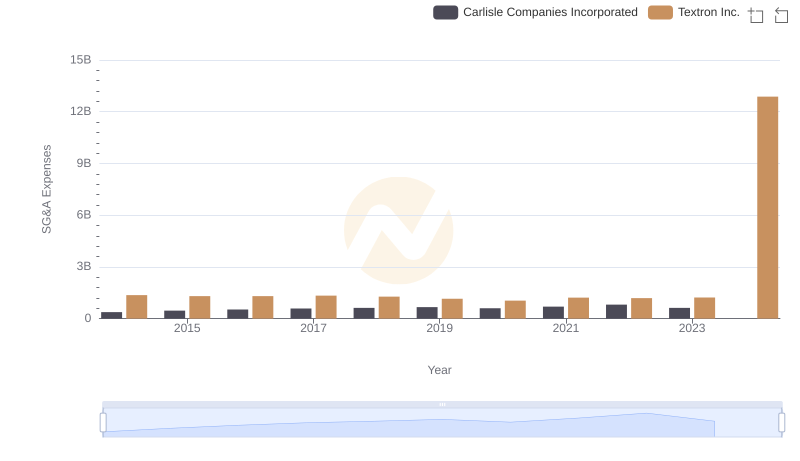
Breaking Down SG&A Expenses: Carlisle Companies Incorporated vs Textron Inc.
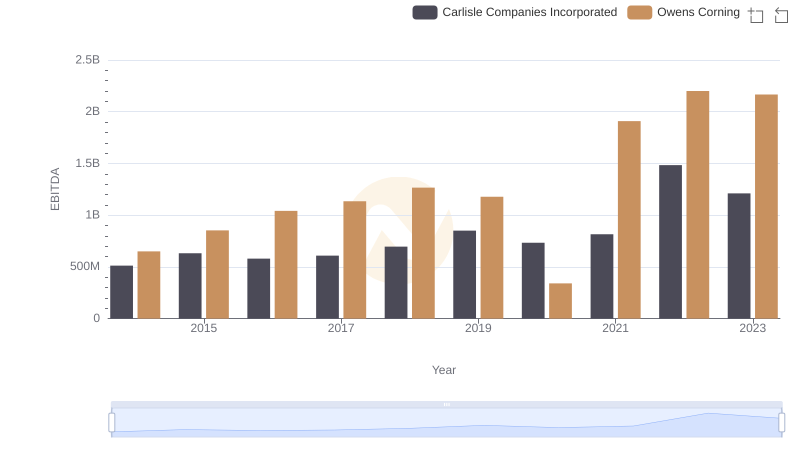
Comparative EBITDA Analysis: Carlisle Companies Incorporated vs Owens Corning