| __timestamp | Allegion plc | American Airlines Group Inc. |
|---|---|---|
| Wednesday, January 1, 2014 | 527400000 | 1544000000 |
| Thursday, January 1, 2015 | 510500000 | 1394000000 |
| Friday, January 1, 2016 | 559800000 | 1323000000 |
| Sunday, January 1, 2017 | 582500000 | 1477000000 |
| Monday, January 1, 2018 | 647500000 | 1520000000 |
| Tuesday, January 1, 2019 | 687200000 | 1602000000 |
| Wednesday, January 1, 2020 | 635700000 | 513000000 |
| Friday, January 1, 2021 | 674700000 | 1098000000 |
| Saturday, January 1, 2022 | 736000000 | 1815000000 |
| Sunday, January 1, 2023 | 865600000 | 1799000000 |
| Monday, January 1, 2024 | 887800000 |
Cracking the code
In the ever-evolving landscape of corporate finance, understanding the efficiency of Selling, General, and Administrative (SG&A) expenses is crucial. Allegion plc and American Airlines Group Inc. offer a fascinating comparison over the past decade. From 2014 to 2023, Allegion's SG&A expenses grew by approximately 64%, reflecting a steady increase in operational costs. In contrast, American Airlines experienced a more volatile trajectory, with a notable dip in 2020, likely due to the pandemic's impact on the travel industry. By 2023, American Airlines' SG&A expenses rebounded to nearly 1.8 times their 2014 levels. This analysis highlights the resilience and adaptability of these companies in managing their operational expenses amidst varying economic conditions. As businesses navigate the complexities of the modern economy, such insights into SG&A efficiency become invaluable for investors and stakeholders alike.
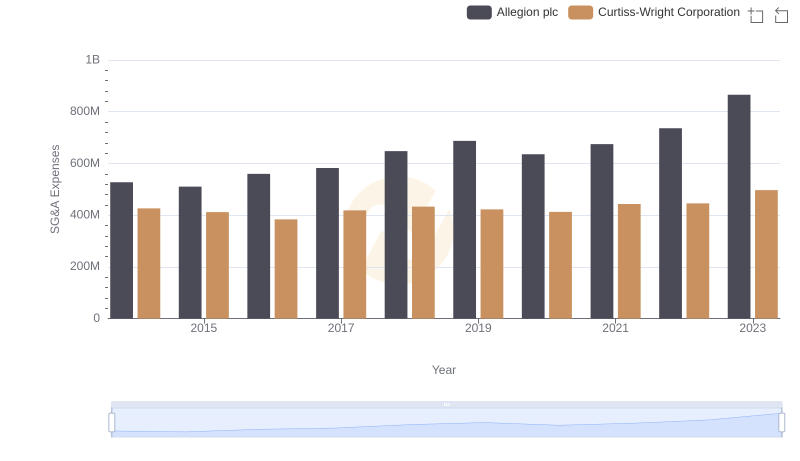
Cost Management Insights: SG&A Expenses for Curtiss-Wright Corporation and Allegion plc
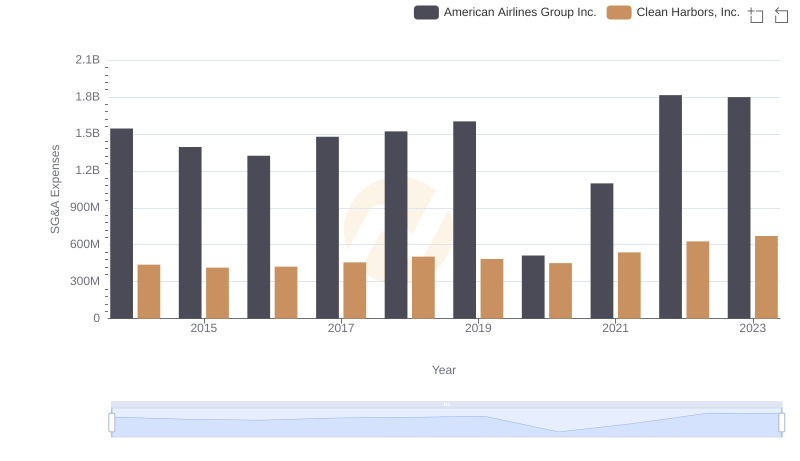
Operational Costs Compared: SG&A Analysis of Clean Harbors, Inc. and American Airlines Group Inc.
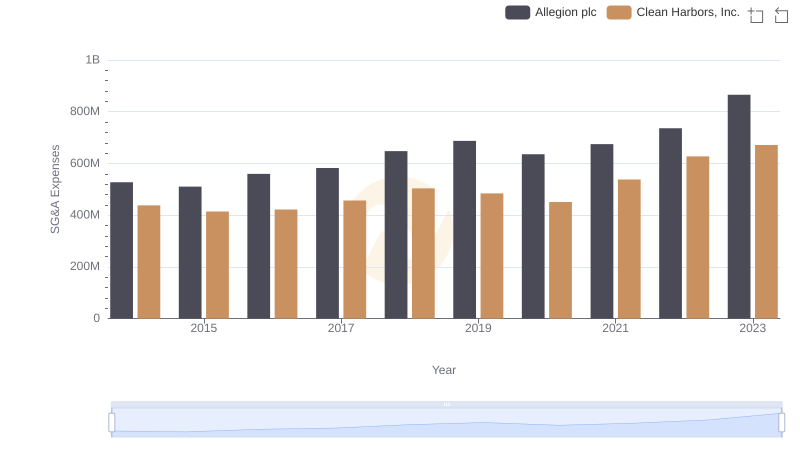
SG&A Efficiency Analysis: Comparing Clean Harbors, Inc. and Allegion plc
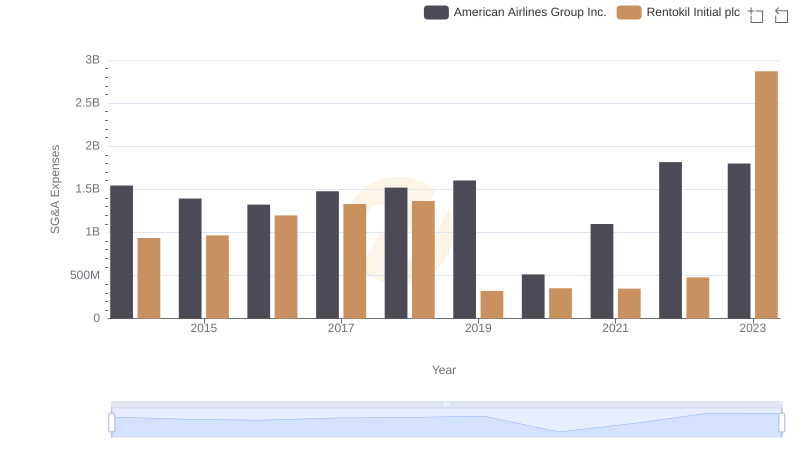
Selling, General, and Administrative Costs: Rentokil Initial plc vs American Airlines Group Inc.
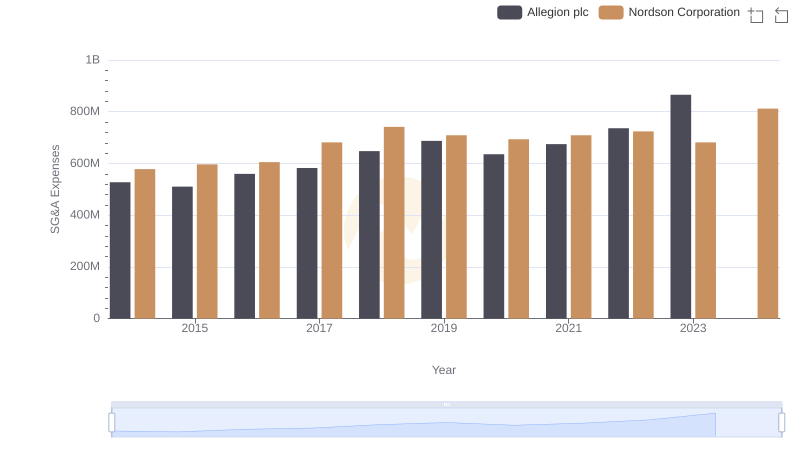
Who Optimizes SG&A Costs Better? Nordson Corporation or Allegion plc
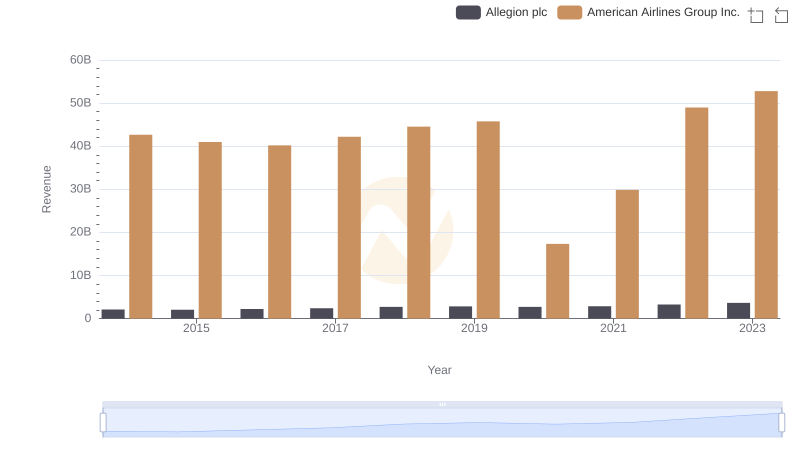
Annual Revenue Comparison: Allegion plc vs American Airlines Group Inc.
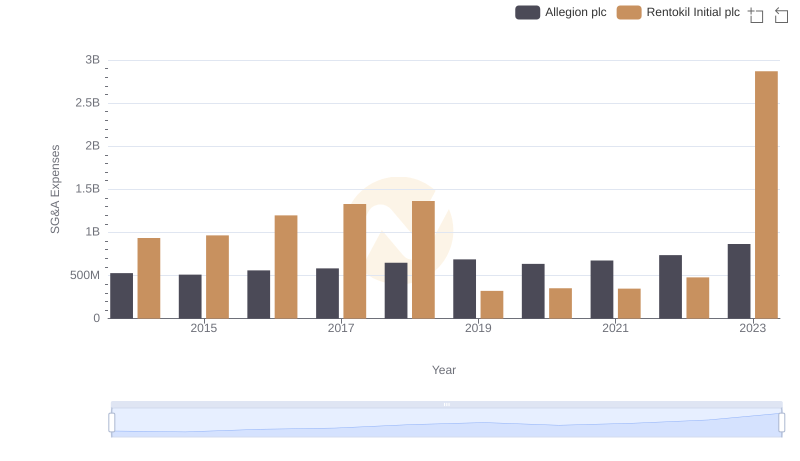
Rentokil Initial plc vs Allegion plc: SG&A Expense Trends
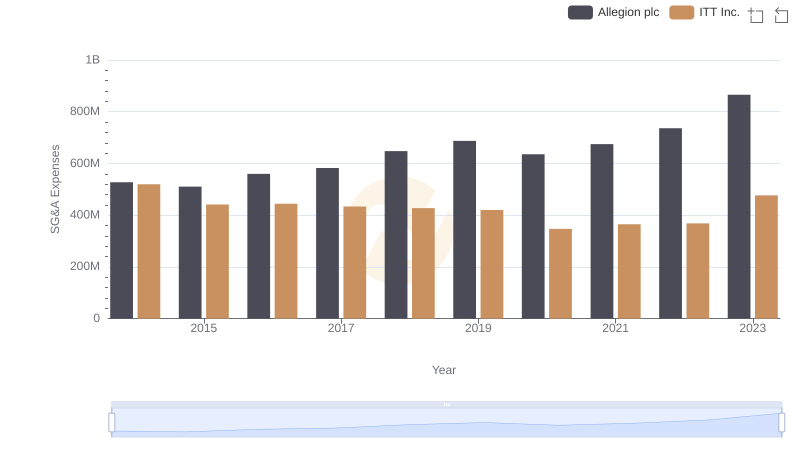
Operational Costs Compared: SG&A Analysis of ITT Inc. and Allegion plc