| __timestamp | Pure Storage, Inc. | SAP SE |
|---|---|---|
| Wednesday, January 1, 2014 | 60652000 | 5195000000 |
| Thursday, January 1, 2015 | 184674000 | 6449000000 |
| Friday, January 1, 2016 | 315976000 | 7299000000 |
| Sunday, January 1, 2017 | 444687000 | 7999000000 |
| Monday, January 1, 2018 | 575200000 | 7879000000 |
| Tuesday, January 1, 2019 | 721617000 | 9318000000 |
| Wednesday, January 1, 2020 | 891175000 | 8461000000 |
| Friday, January 1, 2021 | 898491000 | 9936000000 |
| Saturday, January 1, 2022 | 988982000 | 11015000000 |
| Sunday, January 1, 2023 | 1121605000 | 10192000000 |
| Monday, January 1, 2024 | 1197264000 | 10254000000 |
In pursuit of knowledge
In the ever-evolving landscape of global business, understanding the financial strategies of industry leaders is crucial. Selling, General, and Administrative (SG&A) expenses are a key indicator of a company's operational efficiency. From 2014 to 2023, SAP SE, a titan in enterprise software, consistently outpaced Pure Storage, Inc., a rising star in data storage solutions, in SG&A spending. SAP SE's expenses peaked in 2022, reaching approximately $11 billion, reflecting its expansive global operations. In contrast, Pure Storage, Inc. demonstrated a steady growth trajectory, with SG&A expenses increasing nearly 20-fold over the same period, from $60 million in 2014 to $1.2 billion in 2024. This growth underscores Pure Storage's aggressive market expansion and investment in sales and marketing. Notably, data for SAP SE in 2024 is unavailable, highlighting potential shifts in financial strategies or reporting. This analysis offers a window into the strategic priorities of these two industry players.
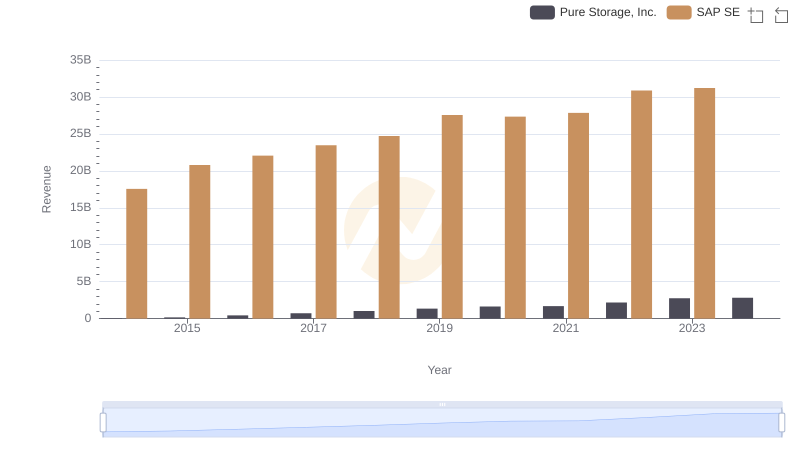
SAP SE and Pure Storage, Inc.: A Comprehensive Revenue Analysis
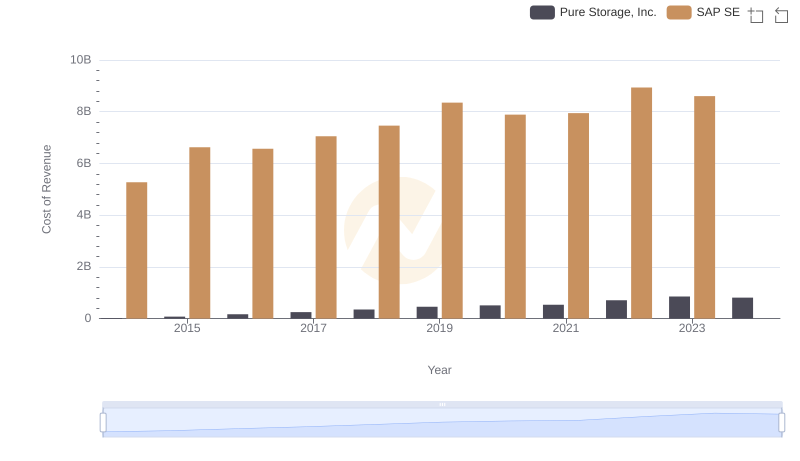
Comparing Cost of Revenue Efficiency: SAP SE vs Pure Storage, Inc.
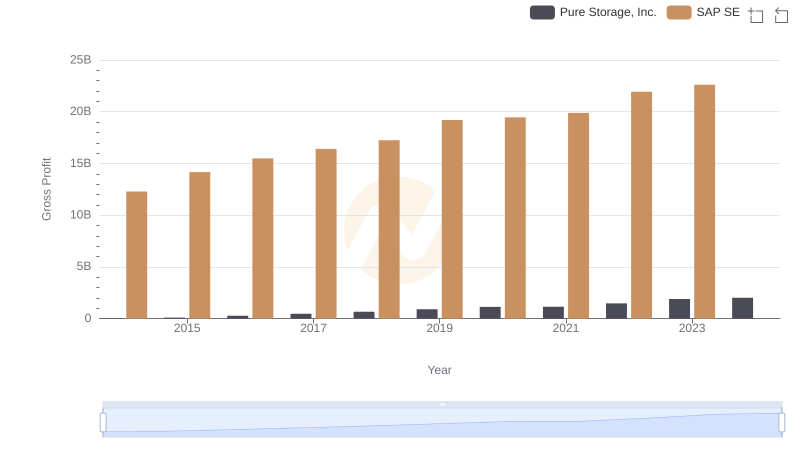
Gross Profit Comparison: SAP SE and Pure Storage, Inc. Trends
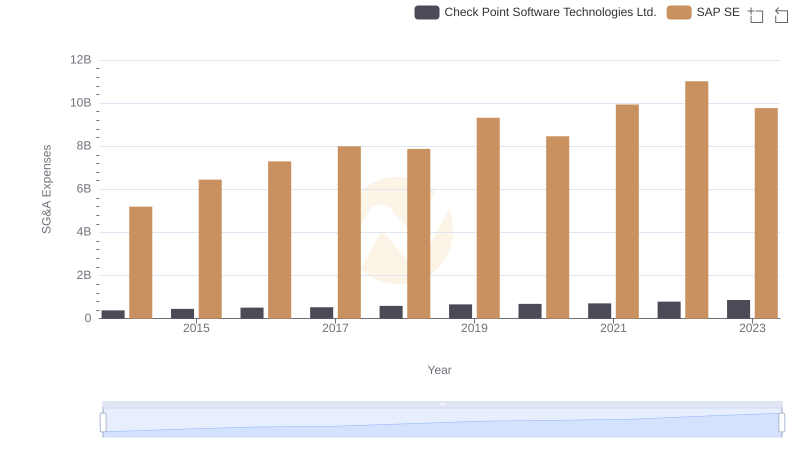
Who Optimizes SG&A Costs Better? SAP SE or Check Point Software Technologies Ltd.
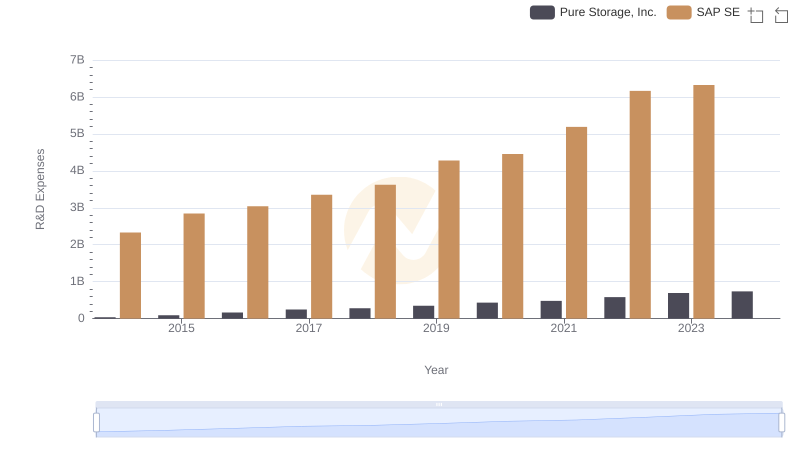
Research and Development Investment: SAP SE vs Pure Storage, Inc.
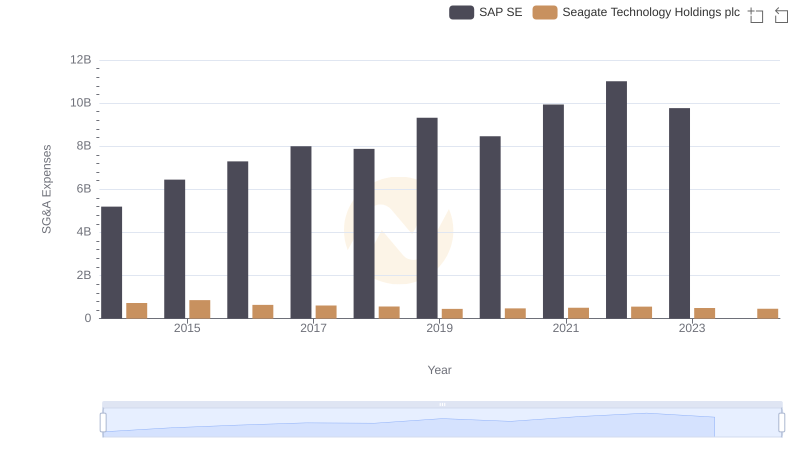
Operational Costs Compared: SG&A Analysis of SAP SE and Seagate Technology Holdings plc
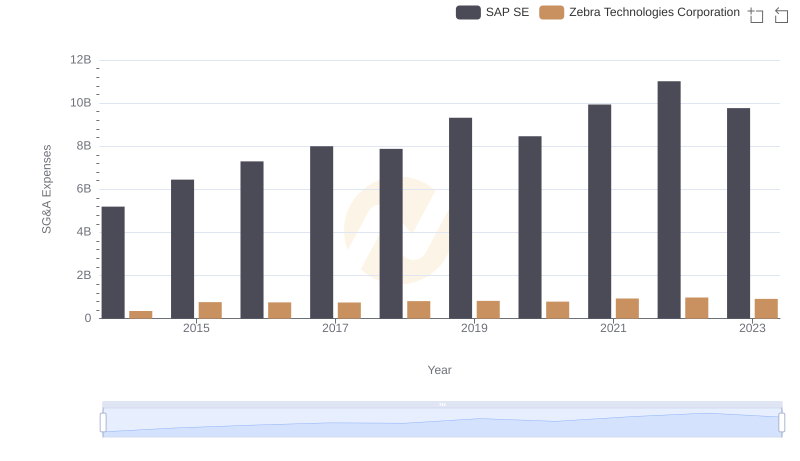
Cost Management Insights: SG&A Expenses for SAP SE and Zebra Technologies Corporation
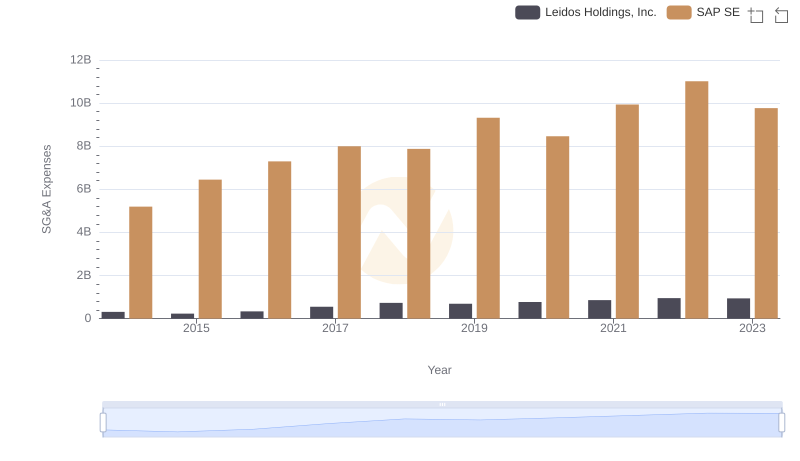
Breaking Down SG&A Expenses: SAP SE vs Leidos Holdings, Inc.
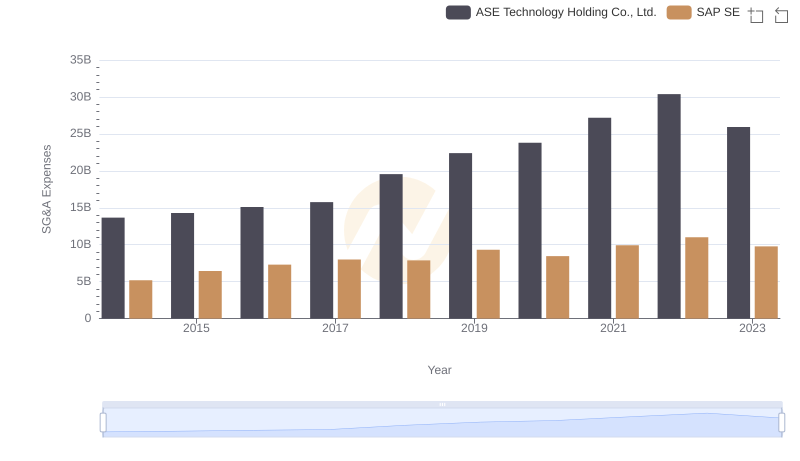
Operational Costs Compared: SG&A Analysis of SAP SE and ASE Technology Holding Co., Ltd.
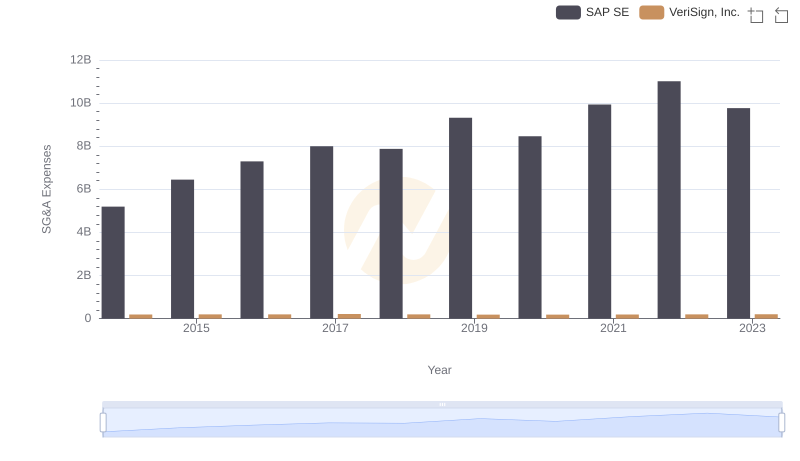
Breaking Down SG&A Expenses: SAP SE vs VeriSign, Inc.
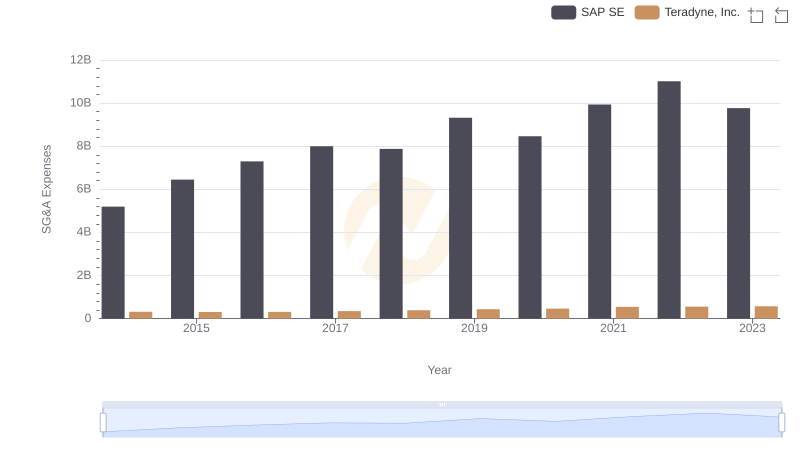
Operational Costs Compared: SG&A Analysis of SAP SE and Teradyne, Inc.
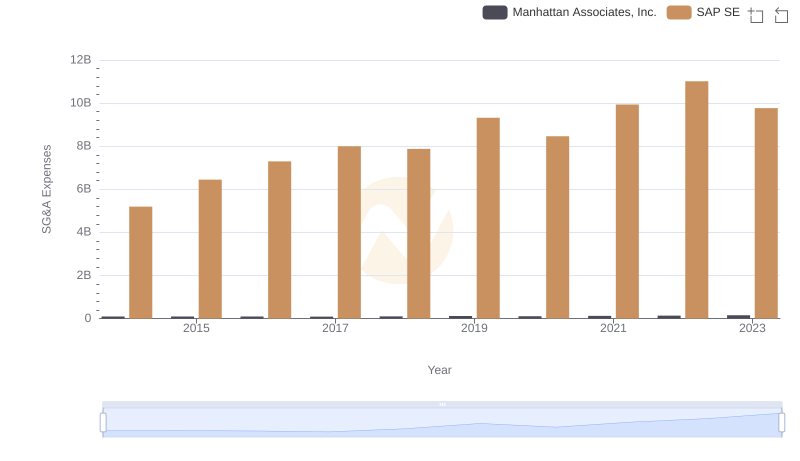
Cost Management Insights: SG&A Expenses for SAP SE and Manhattan Associates, Inc.