| __timestamp | Analog Devices, Inc. | Oracle Corporation |
|---|---|---|
| Wednesday, January 1, 2014 | 454676000 | 8605000000 |
| Thursday, January 1, 2015 | 478972000 | 8732000000 |
| Friday, January 1, 2016 | 461438000 | 9039000000 |
| Sunday, January 1, 2017 | 691046000 | 9299000000 |
| Monday, January 1, 2018 | 695937000 | 9715000000 |
| Tuesday, January 1, 2019 | 648094000 | 9774000000 |
| Wednesday, January 1, 2020 | 659923000 | 9275000000 |
| Friday, January 1, 2021 | 915418000 | 8936000000 |
| Saturday, January 1, 2022 | 1266175000 | 9364000000 |
| Sunday, January 1, 2023 | 1273584000 | 10412000000 |
| Monday, January 1, 2024 | 1068640000 | 9822000000 |
Infusing magic into the data realm
In the ever-evolving landscape of technology, understanding the financial health of industry leaders is crucial. This chart provides a fascinating glimpse into the Selling, General, and Administrative (SG&A) expenses of Oracle Corporation and Analog Devices, Inc. over the past decade. From 2014 to 2024, Oracle's SG&A expenses have consistently dwarfed those of Analog Devices, averaging nearly 12 times higher. This disparity highlights Oracle's expansive operational scale and its strategic investments in marketing and administration.
Interestingly, Analog Devices has shown a remarkable growth trajectory, with its SG&A expenses increasing by approximately 180% from 2014 to 2023. This surge reflects the company's aggressive expansion and adaptation strategies in a competitive market. Meanwhile, Oracle's expenses peaked in 2023, indicating a potential shift in its operational focus. As we look to the future, these trends offer valuable insights into the strategic priorities of these tech titans.
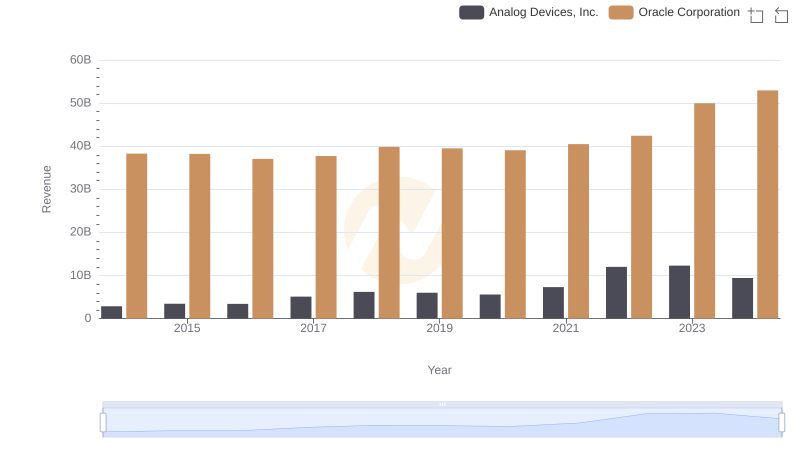
Revenue Insights: Oracle Corporation and Analog Devices, Inc. Performance Compared
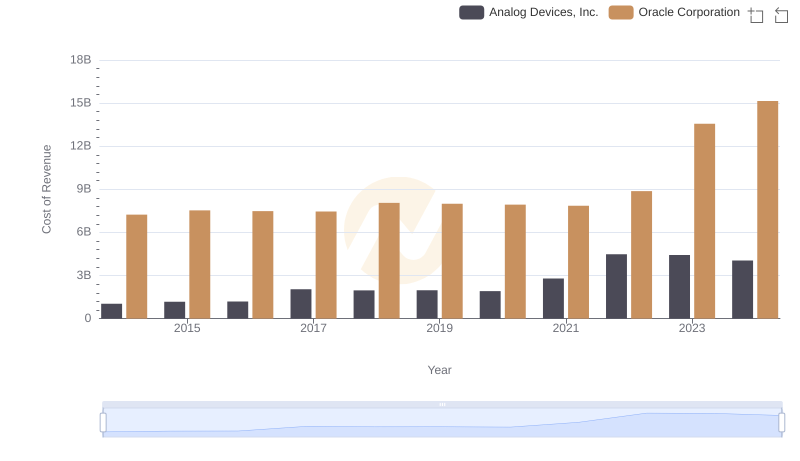
Oracle Corporation vs Analog Devices, Inc.: Efficiency in Cost of Revenue Explored
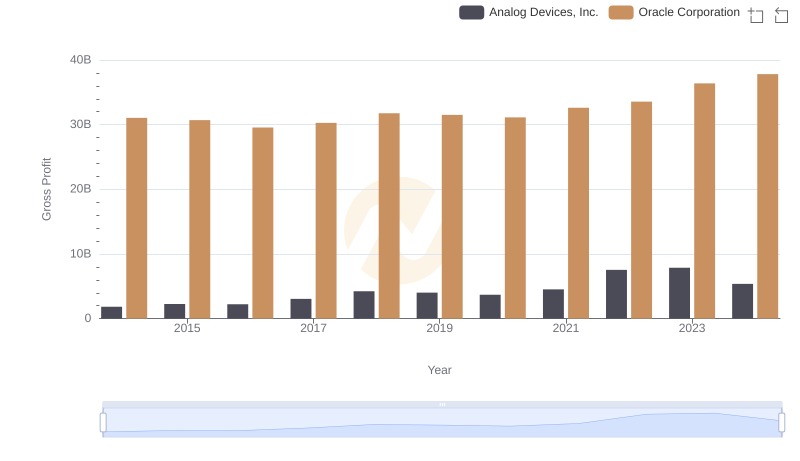
Gross Profit Trends Compared: Oracle Corporation vs Analog Devices, Inc.
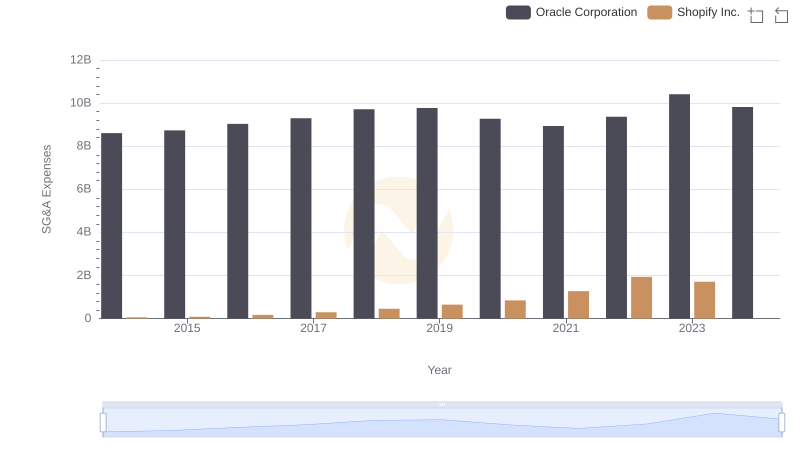
Selling, General, and Administrative Costs: Oracle Corporation vs Shopify Inc.
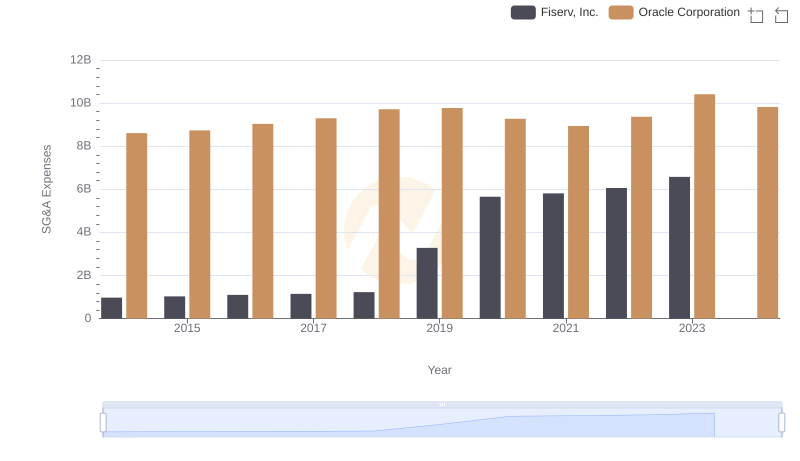
Breaking Down SG&A Expenses: Oracle Corporation vs Fiserv, Inc.
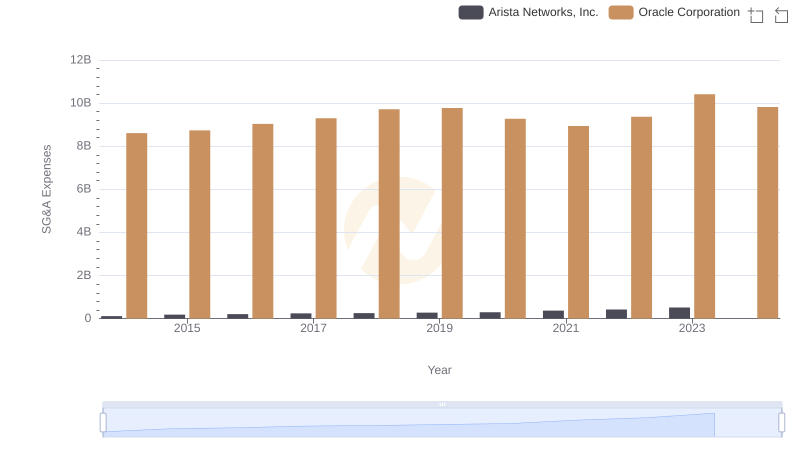
Comparing SG&A Expenses: Oracle Corporation vs Arista Networks, Inc. Trends and Insights
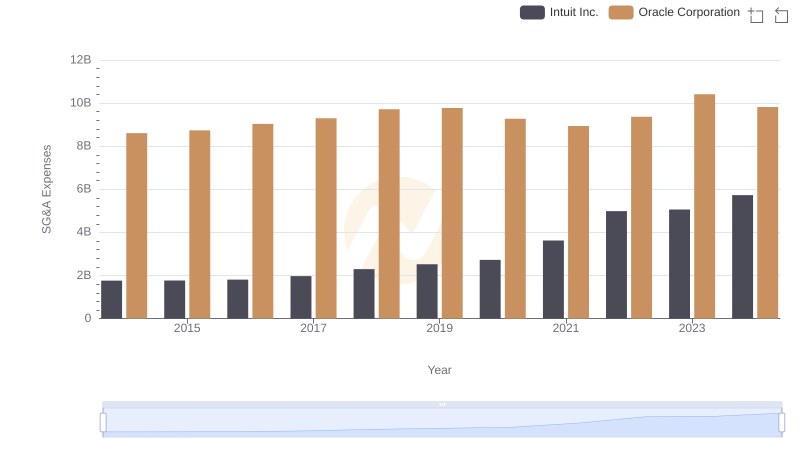
Comparing SG&A Expenses: Oracle Corporation vs Intuit Inc. Trends and Insights
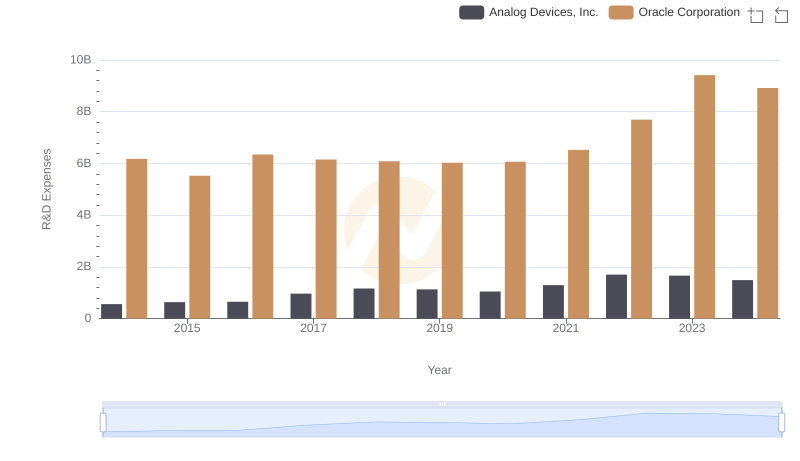
R&D Spending Showdown: Oracle Corporation vs Analog Devices, Inc.
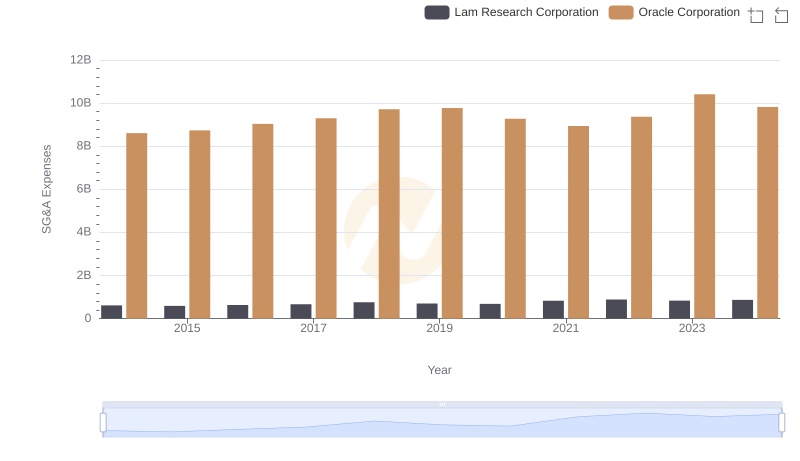
Comparing SG&A Expenses: Oracle Corporation vs Lam Research Corporation Trends and Insights
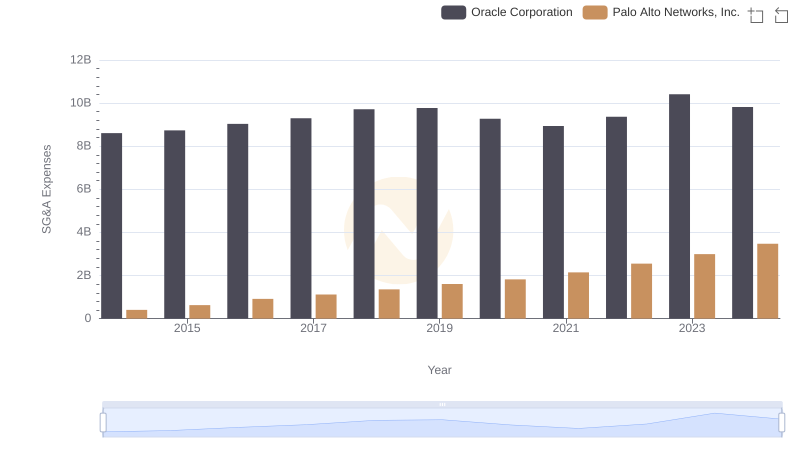
SG&A Efficiency Analysis: Comparing Oracle Corporation and Palo Alto Networks, Inc.
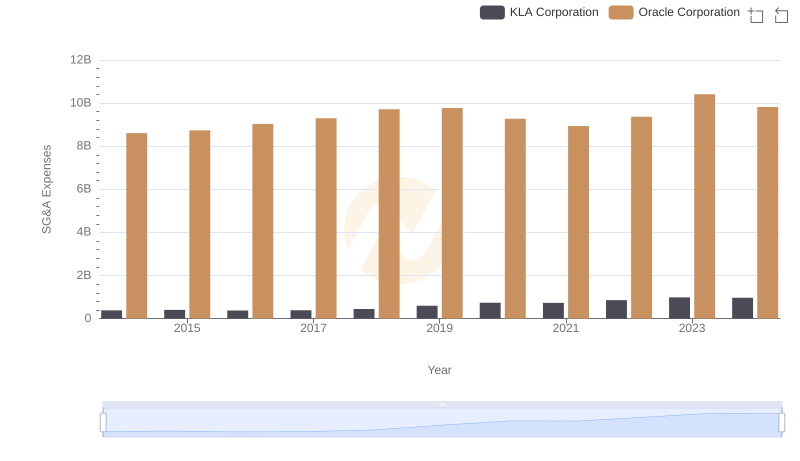
Oracle Corporation vs KLA Corporation: SG&A Expense Trends
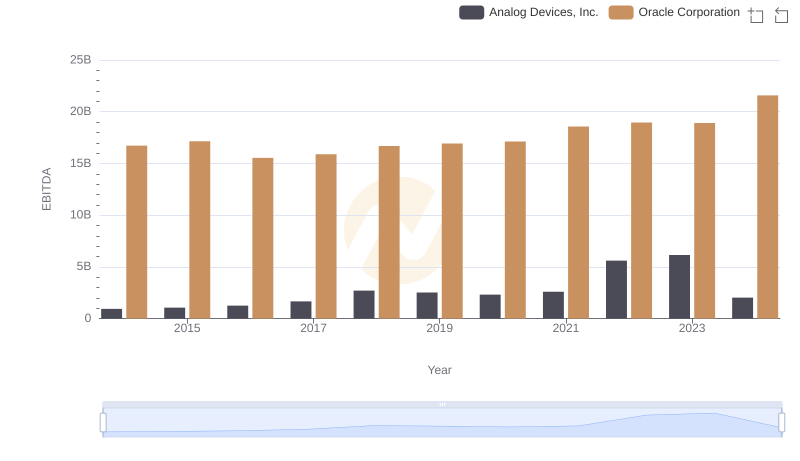
A Side-by-Side Analysis of EBITDA: Oracle Corporation and Analog Devices, Inc.