| __timestamp | Micron Technology, Inc. | NXP Semiconductors N.V. |
|---|---|---|
| Wednesday, January 1, 2014 | 707000000 | 838000000 |
| Thursday, January 1, 2015 | 719000000 | 922000000 |
| Friday, January 1, 2016 | 659000000 | 1141000000 |
| Sunday, January 1, 2017 | 743000000 | 1090000000 |
| Monday, January 1, 2018 | 813000000 | 993000000 |
| Tuesday, January 1, 2019 | 836000000 | 924000000 |
| Wednesday, January 1, 2020 | 881000000 | 879000000 |
| Friday, January 1, 2021 | 894000000 | 956000000 |
| Saturday, January 1, 2022 | 1066000000 | 1066000000 |
| Sunday, January 1, 2023 | 920000000 | 1159000000 |
| Monday, January 1, 2024 | 1129000000 |
Data in motion
In the ever-evolving semiconductor industry, understanding the financial dynamics of key players is crucial. This analysis delves into the Selling, General, and Administrative (SG&A) expenses of Micron Technology, Inc. and NXP Semiconductors N.V. from 2014 to 2023.
Micron's SG&A expenses have shown a steady increase, peaking in 2024 with a 60% rise from 2014. Notably, 2022 marked a significant surge, with expenses reaching parity with NXP at approximately $1.066 billion. Meanwhile, NXP's expenses have consistently outpaced Micron's, culminating in a 38% increase over the decade, with a peak in 2023.
This financial trajectory highlights the strategic investments and operational efficiencies of both companies. However, the absence of NXP's 2024 data leaves room for speculation on its future financial strategies. As the semiconductor landscape continues to shift, these insights offer a glimpse into the fiscal priorities of industry leaders.
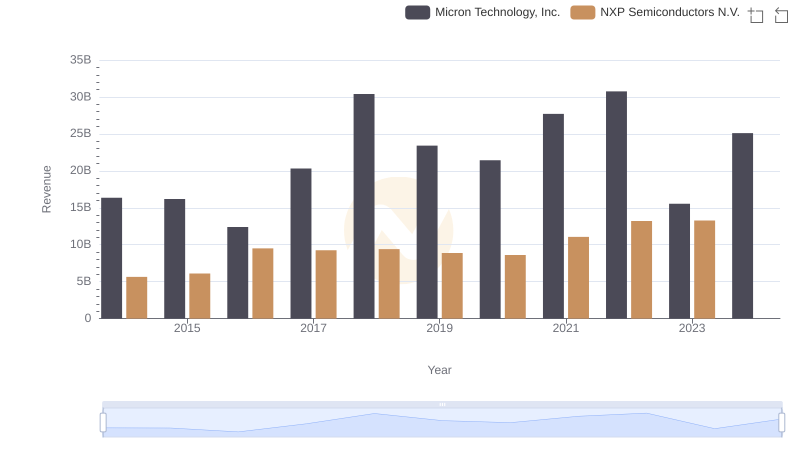
Revenue Insights: Micron Technology, Inc. and NXP Semiconductors N.V. Performance Compared
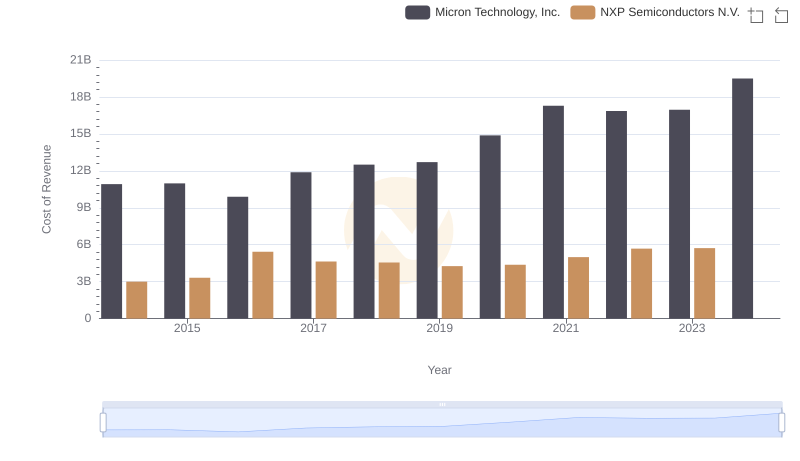
Cost of Revenue Comparison: Micron Technology, Inc. vs NXP Semiconductors N.V.
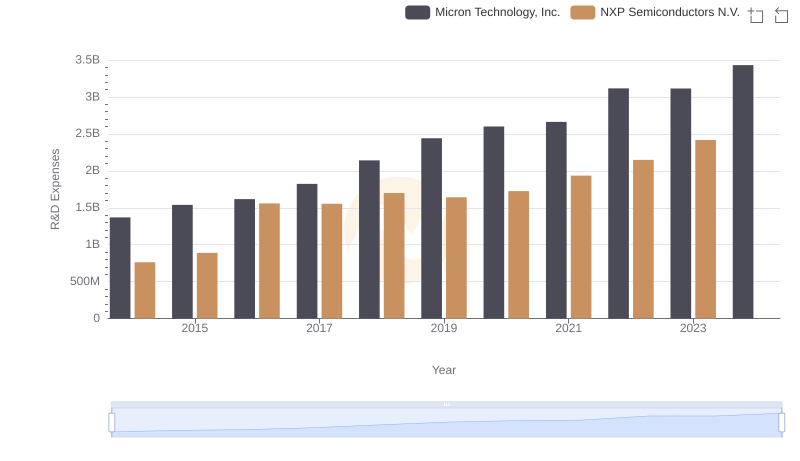
Research and Development: Comparing Key Metrics for Micron Technology, Inc. and NXP Semiconductors N.V.
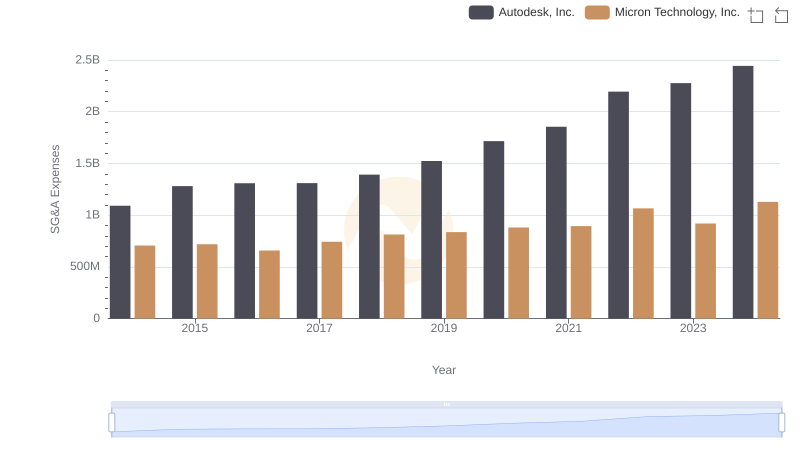
Cost Management Insights: SG&A Expenses for Micron Technology, Inc. and Autodesk, Inc.
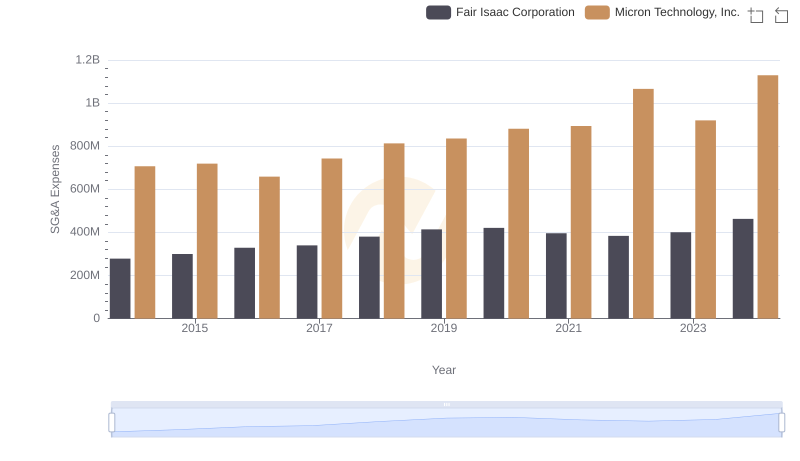
Who Optimizes SG&A Costs Better? Micron Technology, Inc. or Fair Isaac Corporation
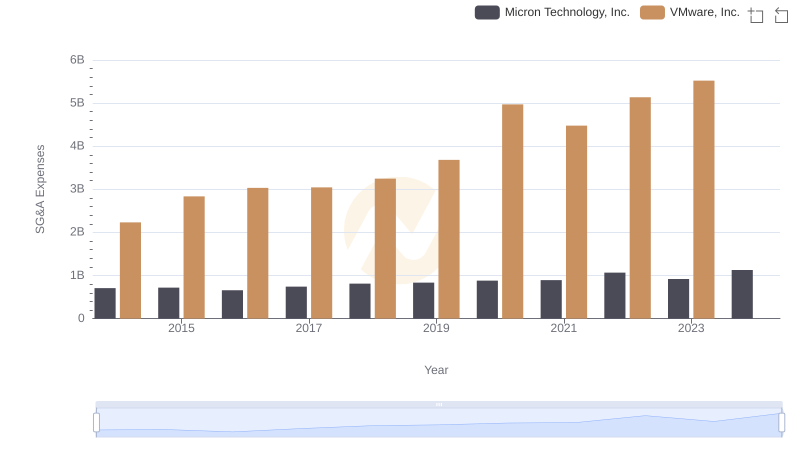
Breaking Down SG&A Expenses: Micron Technology, Inc. vs VMware, Inc.
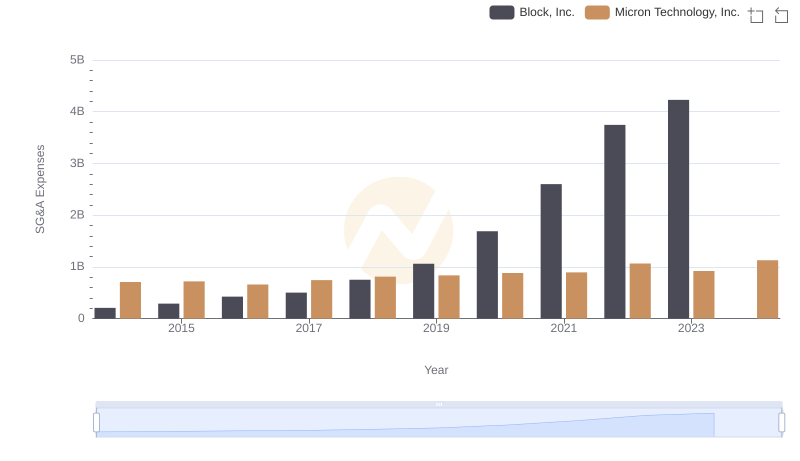
Comparing SG&A Expenses: Micron Technology, Inc. vs Block, Inc. Trends and Insights
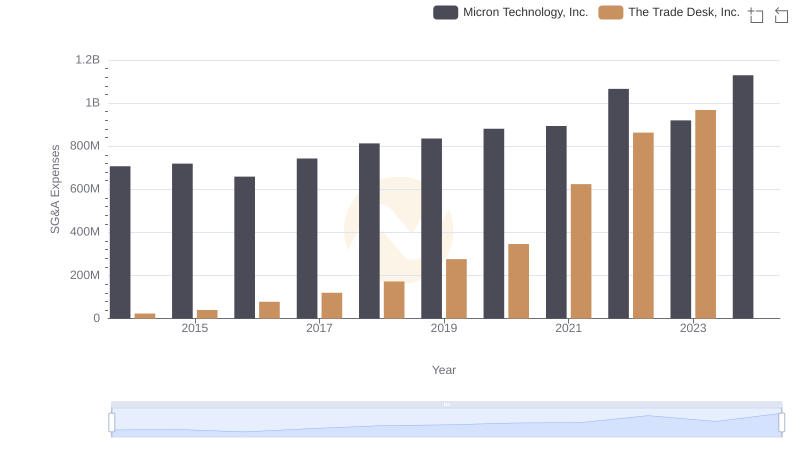
Cost Management Insights: SG&A Expenses for Micron Technology, Inc. and The Trade Desk, Inc.
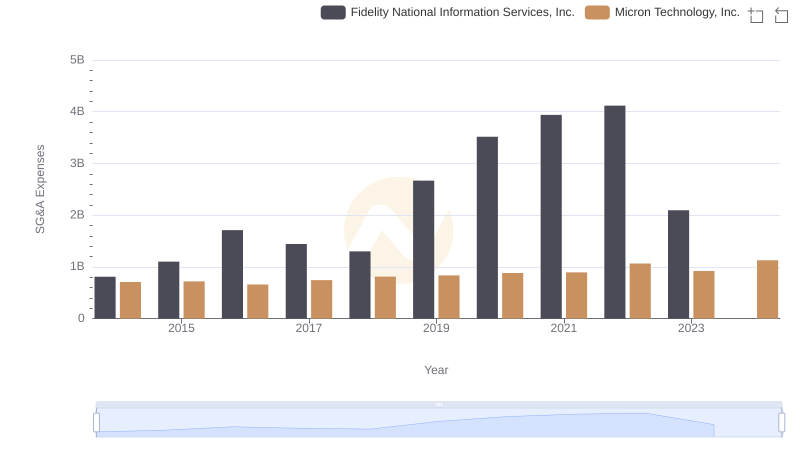
Micron Technology, Inc. or Fidelity National Information Services, Inc.: Who Manages SG&A Costs Better?
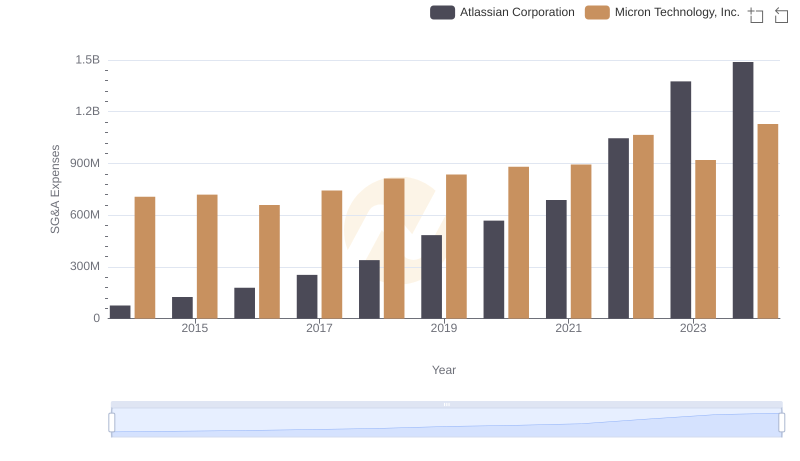
Operational Costs Compared: SG&A Analysis of Micron Technology, Inc. and Atlassian Corporation
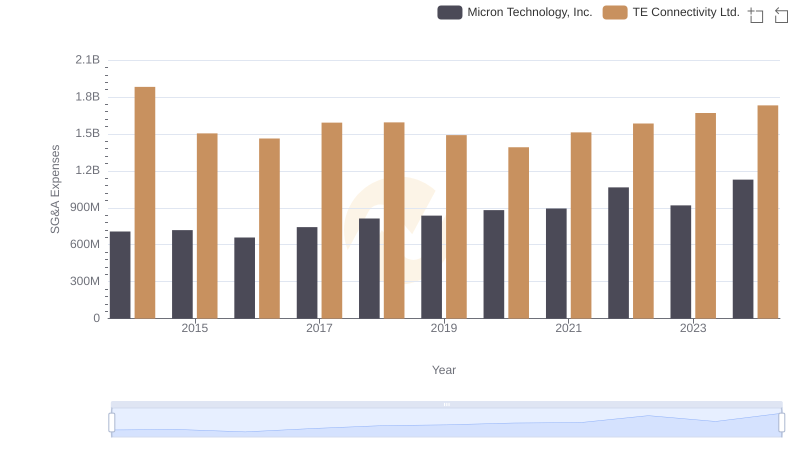
Selling, General, and Administrative Costs: Micron Technology, Inc. vs TE Connectivity Ltd.
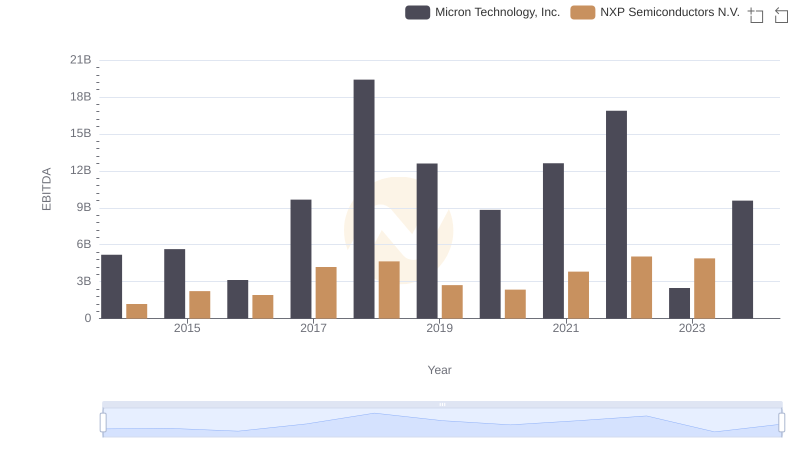
EBITDA Metrics Evaluated: Micron Technology, Inc. vs NXP Semiconductors N.V.