| __timestamp | Ingersoll Rand Inc. | RTX Corporation |
|---|---|---|
| Wednesday, January 1, 2014 | 936781000 | 17653000000 |
| Thursday, January 1, 2015 | 779100000 | 15667000000 |
| Friday, January 1, 2016 | 716731000 | 15784000000 |
| Sunday, January 1, 2017 | 897900000 | 15884000000 |
| Monday, January 1, 2018 | 1012500000 | 16516000000 |
| Tuesday, January 1, 2019 | 911700000 | 19981000000 |
| Wednesday, January 1, 2020 | 1613400000 | 8531000000 |
| Friday, January 1, 2021 | 1988500000 | 12491000000 |
| Saturday, January 1, 2022 | 2325600000 | 13668000000 |
| Sunday, January 1, 2023 | 2882200000 | 12089000000 |
| Monday, January 1, 2024 | 0 | 15410000000 |
Unleashing insights
In the competitive landscape of industrial giants, RTX Corporation and Ingersoll Rand Inc. have showcased intriguing gross profit trajectories over the past decade. From 2014 to 2023, RTX Corporation consistently outperformed, with gross profits peaking in 2019 at approximately $20 billion. However, the pandemic year of 2020 saw a significant dip, with profits dropping by over 50% to around $8.5 billion. In contrast, Ingersoll Rand Inc. demonstrated a steady upward trend, culminating in a 2023 gross profit of nearly $2.9 billion, marking a 200% increase from 2014. This divergence highlights RTX's vulnerability to market shocks and Ingersoll Rand's resilience. As we look to 2024, RTX's missing data leaves room for speculation, while Ingersoll Rand's consistent growth suggests a promising future.
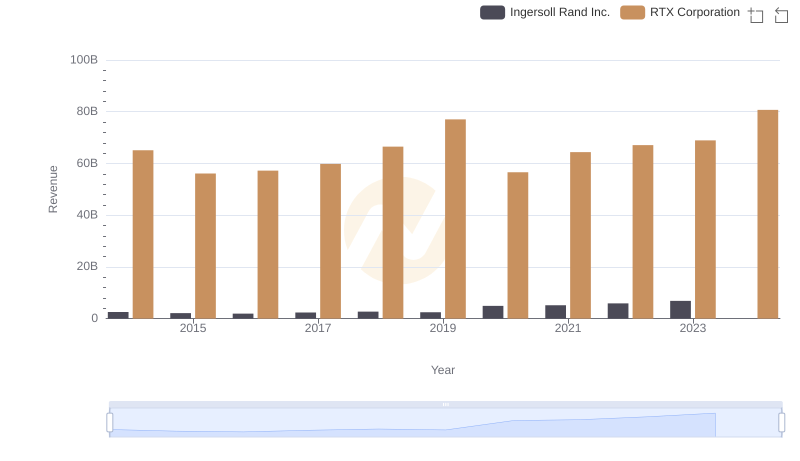
Revenue Showdown: RTX Corporation vs Ingersoll Rand Inc.
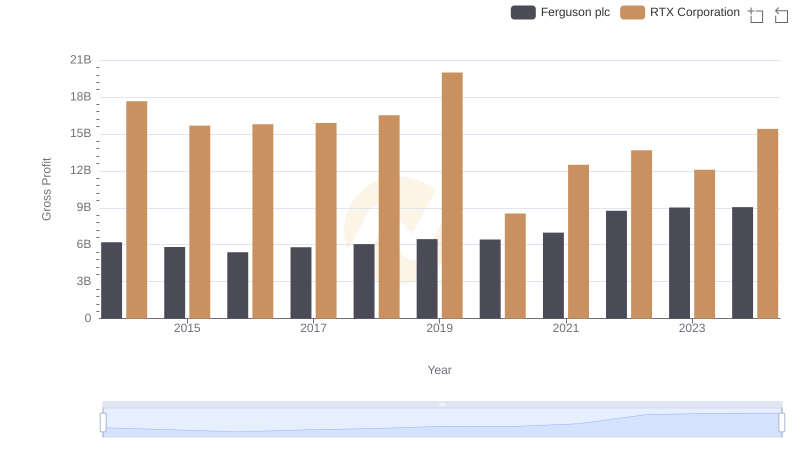
Key Insights on Gross Profit: RTX Corporation vs Ferguson plc

RTX Corporation vs Westinghouse Air Brake Technologies Corporation: A Gross Profit Performance Breakdown
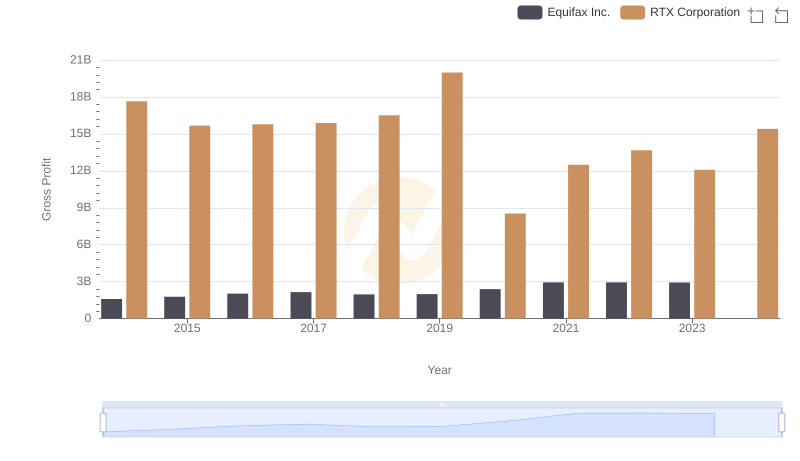
Who Generates Higher Gross Profit? RTX Corporation or Equifax Inc.
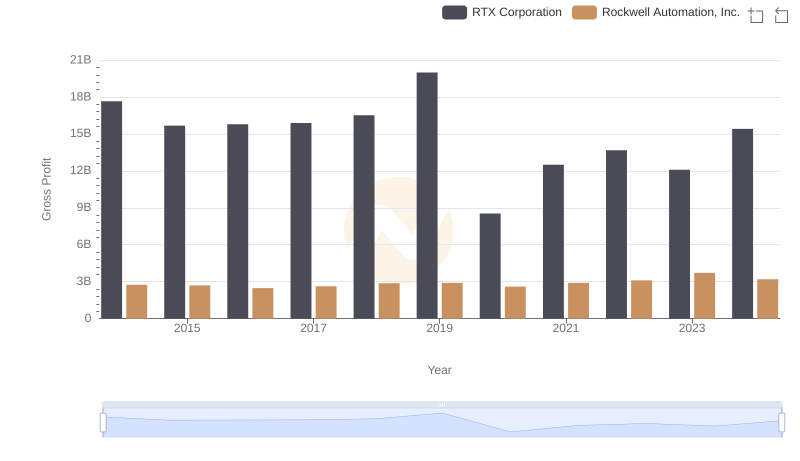
Who Generates Higher Gross Profit? RTX Corporation or Rockwell Automation, Inc.
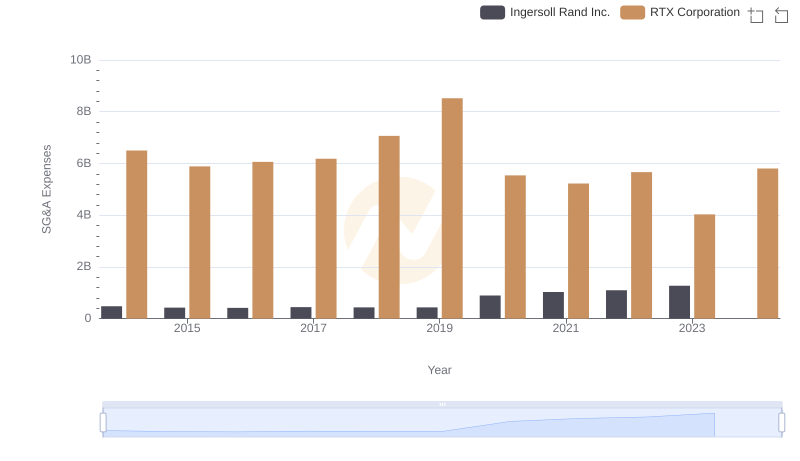
Who Optimizes SG&A Costs Better? RTX Corporation or Ingersoll Rand Inc.