| __timestamp | C.H. Robinson Worldwide, Inc. | Nordson Corporation |
|---|---|---|
| Wednesday, January 1, 2014 | 13470067000 | 1704021000 |
| Thursday, January 1, 2015 | 13476084000 | 1688666000 |
| Friday, January 1, 2016 | 13144413000 | 1808994000 |
| Sunday, January 1, 2017 | 14869380000 | 2066982000 |
| Monday, January 1, 2018 | 16631172000 | 2254668000 |
| Tuesday, January 1, 2019 | 15309508000 | 2194226000 |
| Wednesday, January 1, 2020 | 16207106000 | 2121100000 |
| Friday, January 1, 2021 | 23102138000 | 2362209000 |
| Saturday, January 1, 2022 | 24696625000 | 2590278000 |
| Sunday, January 1, 2023 | 17596443000 | 2628632000 |
| Monday, January 1, 2024 | 17724956000 | 2689921000 |
Data in motion
In the competitive landscape of logistics and manufacturing, C.H. Robinson Worldwide, Inc. and Nordson Corporation have showcased intriguing revenue trajectories over the past decade. From 2014 to 2024, C.H. Robinson's revenue surged by approximately 32%, peaking in 2022 with a remarkable 24.7 billion USD. However, a slight dip followed, with 2023 and 2024 revenues stabilizing around 17.7 billion USD. Meanwhile, Nordson Corporation demonstrated consistent growth, with revenues climbing nearly 58% from 2014 to 2024, reaching 2.69 billion USD. This steady ascent underscores Nordson's resilience and strategic market positioning.
C.H. Robinson's revenue fluctuations highlight the dynamic nature of the logistics sector, influenced by global trade patterns and economic shifts. In contrast, Nordson's steady growth reflects its robust foothold in the manufacturing industry, driven by innovation and diversification. These insights offer a glimpse into the evolving strategies of two industry leaders.
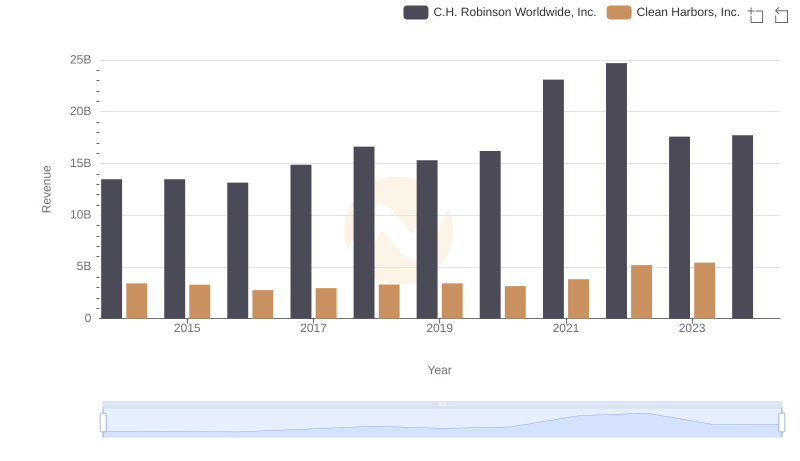
Revenue Showdown: C.H. Robinson Worldwide, Inc. vs Clean Harbors, Inc.
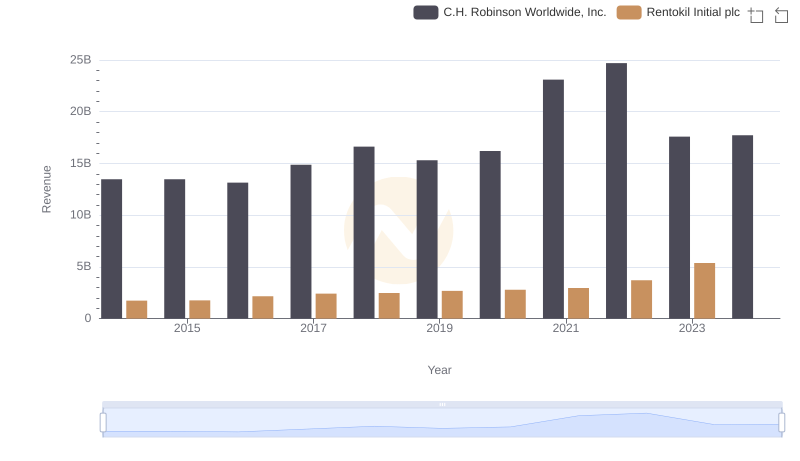
C.H. Robinson Worldwide, Inc. or Rentokil Initial plc: Who Leads in Yearly Revenue?
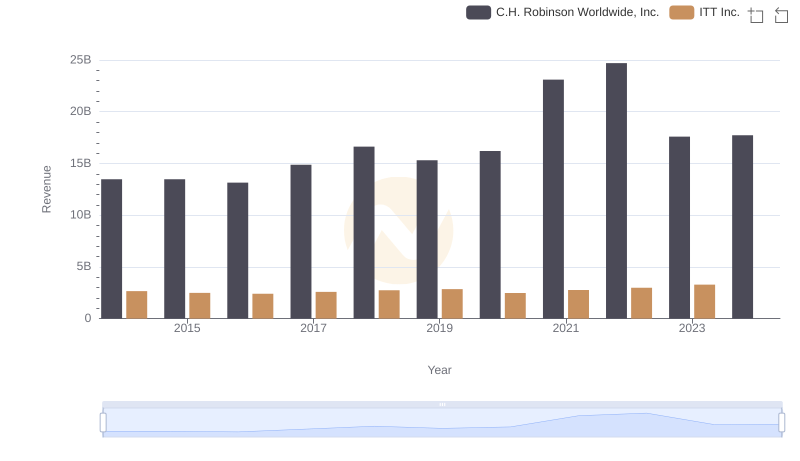
Revenue Showdown: C.H. Robinson Worldwide, Inc. vs ITT Inc.
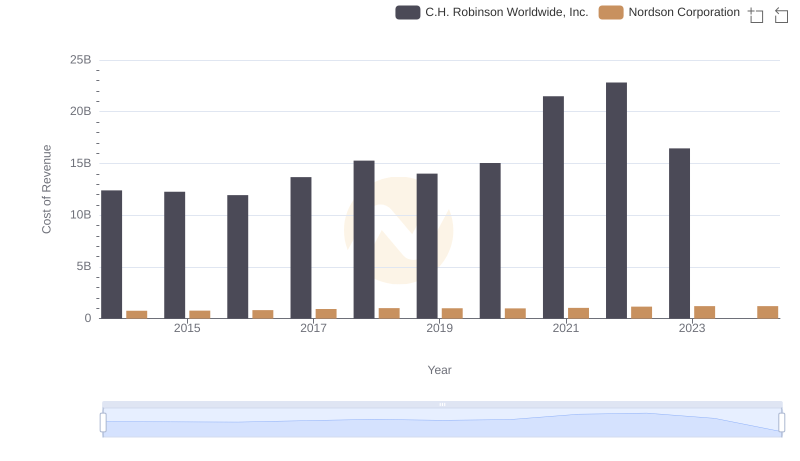
C.H. Robinson Worldwide, Inc. vs Nordson Corporation: Efficiency in Cost of Revenue Explored
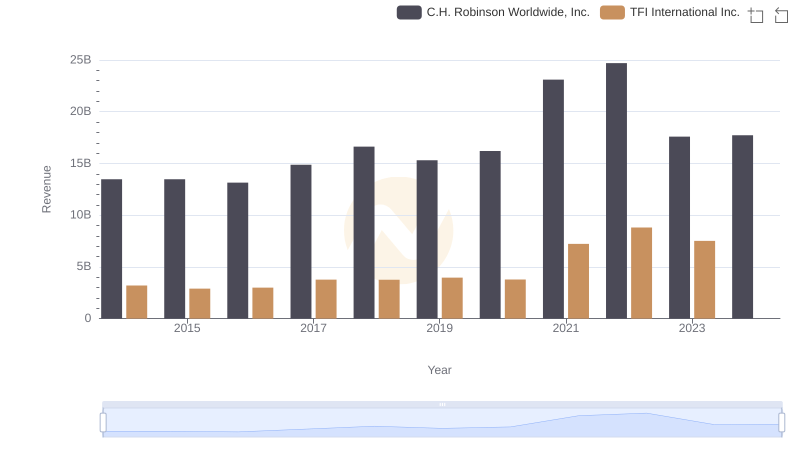
Revenue Insights: C.H. Robinson Worldwide, Inc. and TFI International Inc. Performance Compared
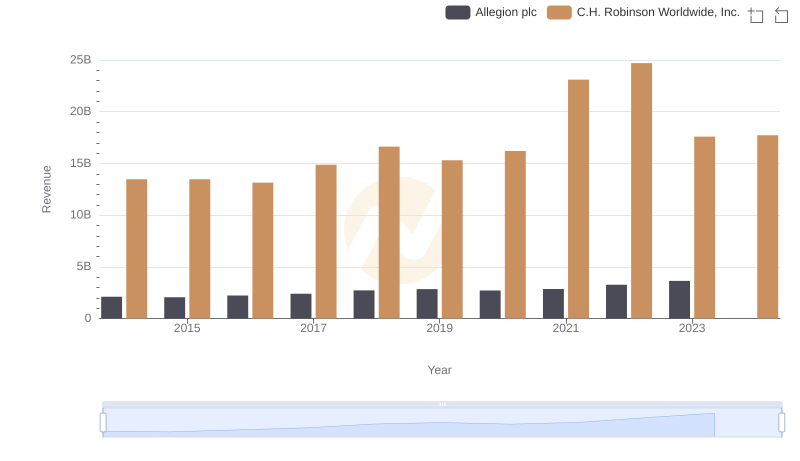
Who Generates More Revenue? C.H. Robinson Worldwide, Inc. or Allegion plc
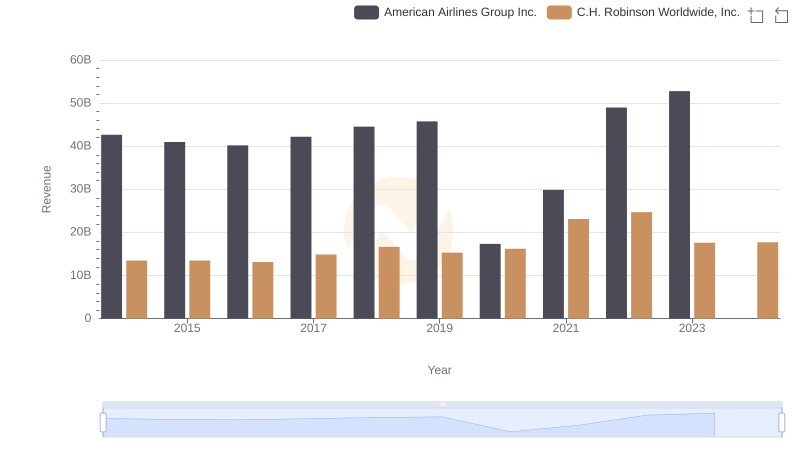
Who Generates More Revenue? C.H. Robinson Worldwide, Inc. or American Airlines Group Inc.
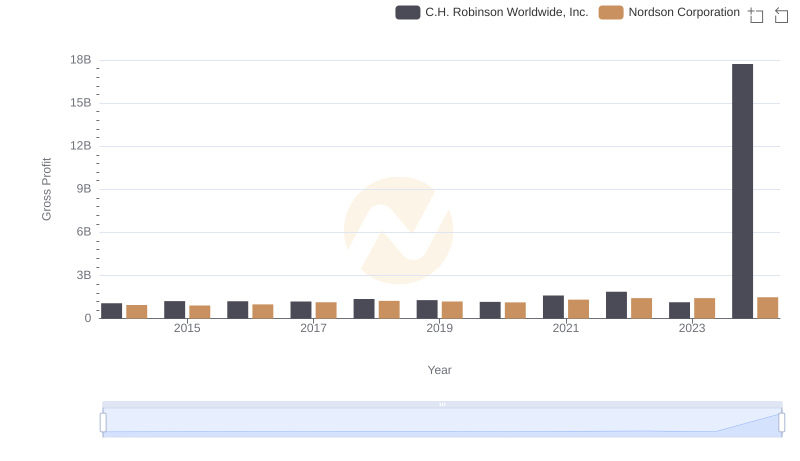
Who Generates Higher Gross Profit? C.H. Robinson Worldwide, Inc. or Nordson Corporation
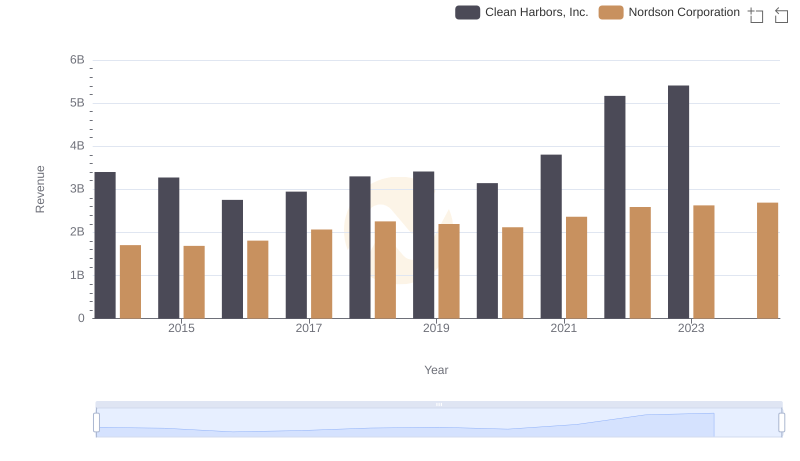
Clean Harbors, Inc. or Nordson Corporation: Who Leads in Yearly Revenue?
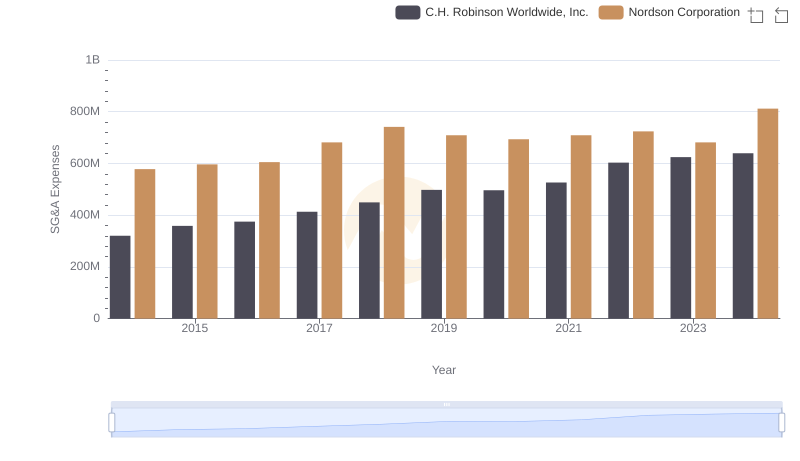
Comparing SG&A Expenses: C.H. Robinson Worldwide, Inc. vs Nordson Corporation Trends and Insights