| __timestamp | Apple Inc. | Applied Materials, Inc. |
|---|---|---|
| Wednesday, January 1, 2014 | 6041000000 | 1428000000 |
| Thursday, January 1, 2015 | 8067000000 | 1451000000 |
| Friday, January 1, 2016 | 10045000000 | 1540000000 |
| Sunday, January 1, 2017 | 11581000000 | 1774000000 |
| Monday, January 1, 2018 | 14236000000 | 2019000000 |
| Tuesday, January 1, 2019 | 16217000000 | 2054000000 |
| Wednesday, January 1, 2020 | 18752000000 | 2234000000 |
| Friday, January 1, 2021 | 21914000000 | 2485000000 |
| Saturday, January 1, 2022 | 26251000000 | 2771000000 |
| Sunday, January 1, 2023 | 29915000000 | 3102000000 |
| Monday, January 1, 2024 | 31370000000 | 3233000000 |
Cracking the code
In the ever-evolving tech landscape, research and development (R&D) are pivotal for innovation and growth. Over the past decade, Apple Inc. and Applied Materials, Inc. have demonstrated contrasting R&D investment strategies. From 2014 to 2024, Apple Inc. has consistently increased its R&D spending, growing by over 400%, from approximately $6 billion to over $31 billion. This reflects Apple's commitment to maintaining its competitive edge in consumer electronics. In contrast, Applied Materials, Inc., a leader in materials engineering solutions, has seen a more modest increase of around 126%, from $1.4 billion to $3.2 billion. This difference highlights the varying scales and focuses of these tech giants. While Apple invests heavily in product innovation, Applied Materials focuses on specialized advancements. This comparison underscores the diverse approaches to R&D in the tech industry, each tailored to the company's strategic goals.
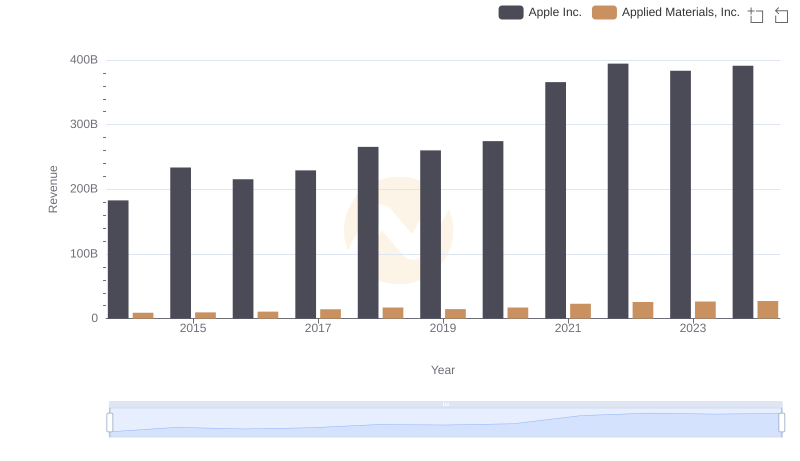
Apple Inc. vs Applied Materials, Inc.: Annual Revenue Growth Compared
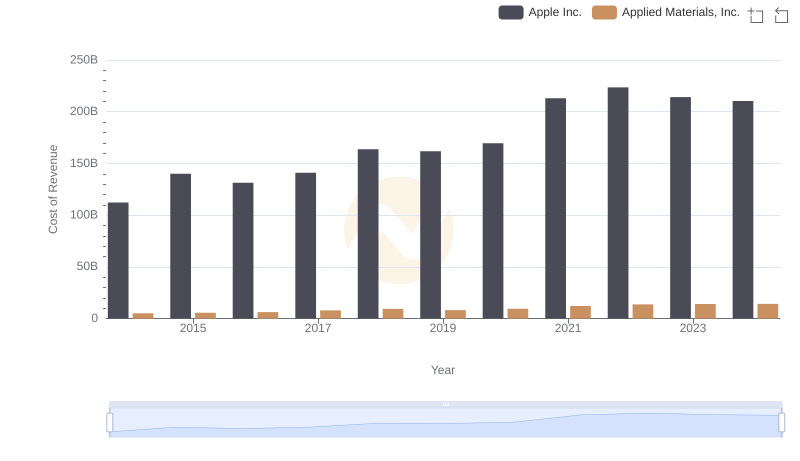
Apple Inc. vs Applied Materials, Inc.: Efficiency in Cost of Revenue Explored
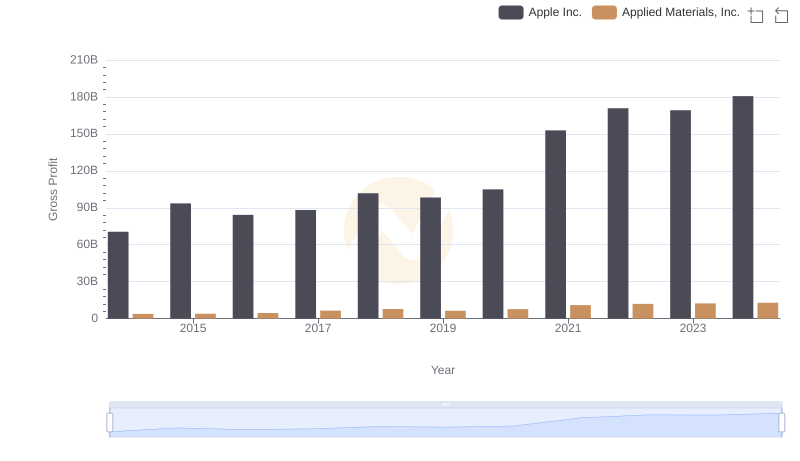
Gross Profit Analysis: Comparing Apple Inc. and Applied Materials, Inc.
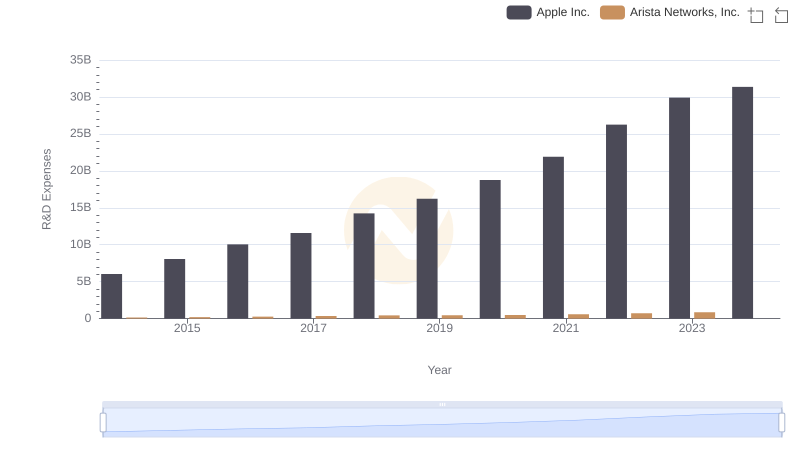
Apple Inc. or Arista Networks, Inc.: Who Invests More in Innovation?
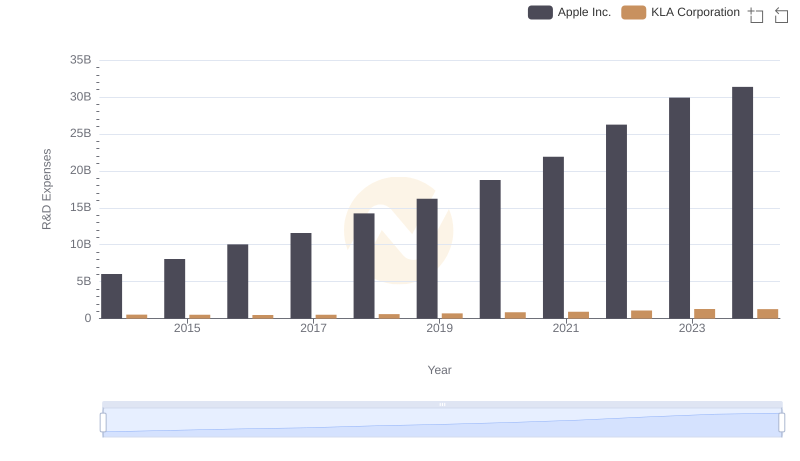
Who Prioritizes Innovation? R&D Spending Compared for Apple Inc. and KLA Corporation
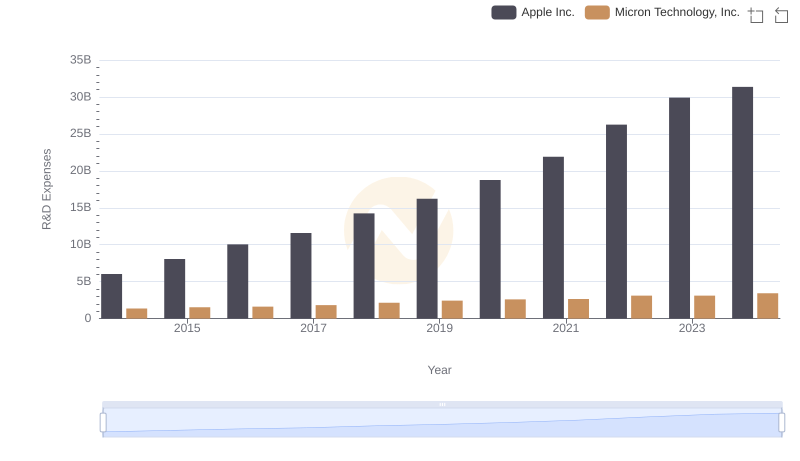
Research and Development Investment: Apple Inc. vs Micron Technology, Inc.
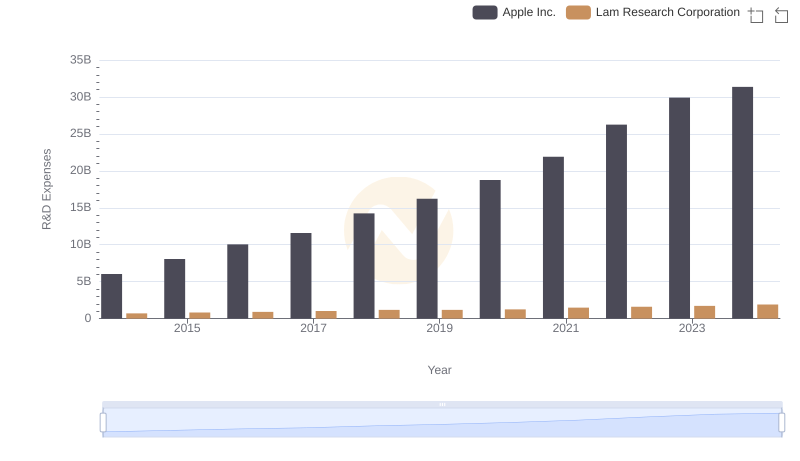
Apple Inc. vs Lam Research Corporation: Strategic Focus on R&D Spending
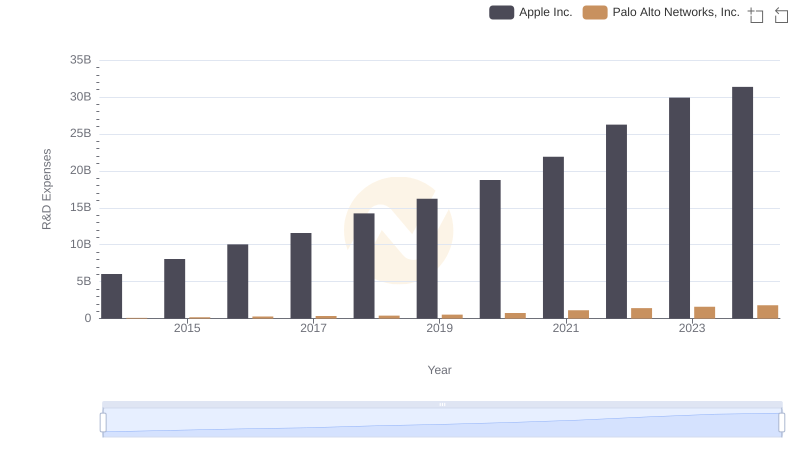
Apple Inc. or Palo Alto Networks, Inc.: Who Invests More in Innovation?
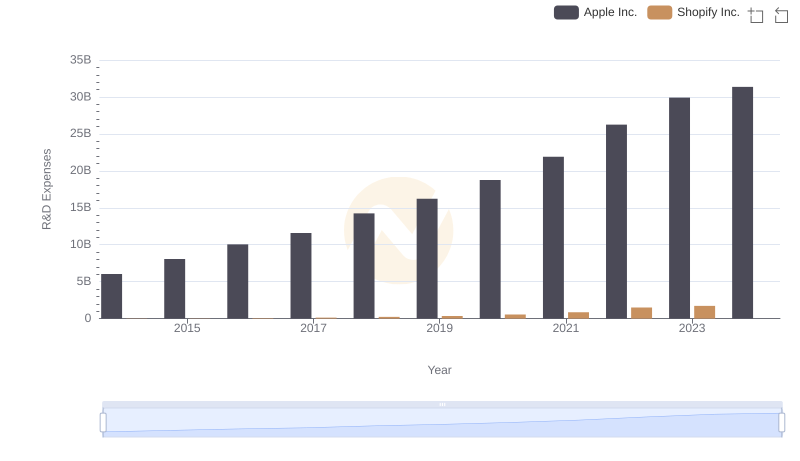
Apple Inc. or Shopify Inc.: Who Invests More in Innovation?
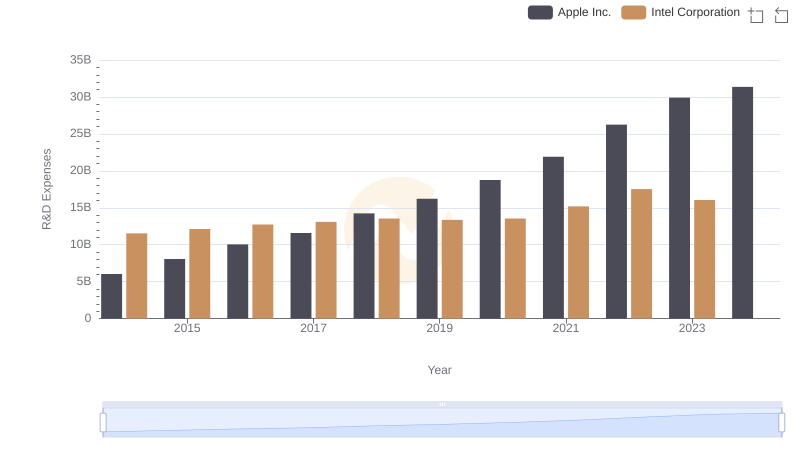
R&D Spending Showdown: Apple Inc. vs Intel Corporation
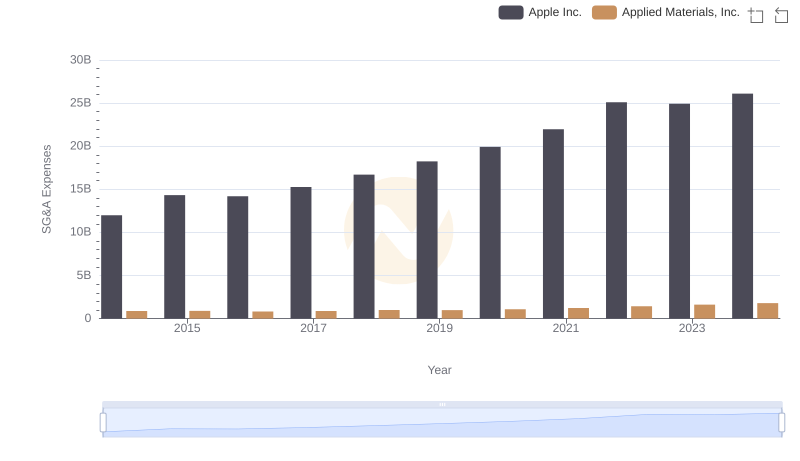
Apple Inc. or Applied Materials, Inc.: Who Manages SG&A Costs Better?
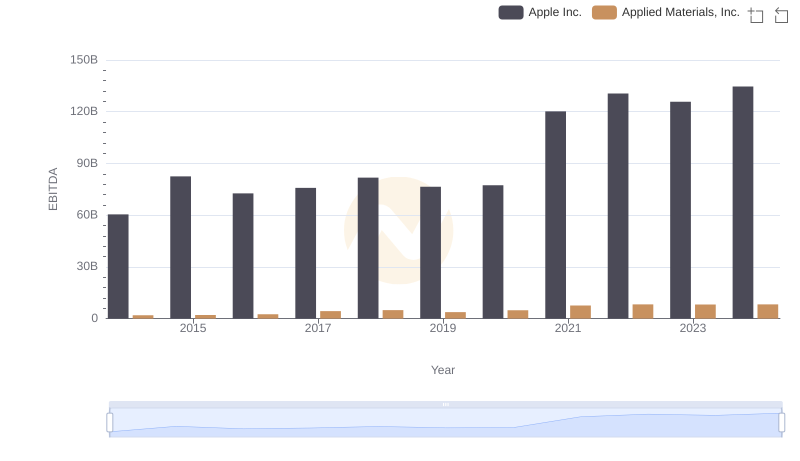
A Side-by-Side Analysis of EBITDA: Apple Inc. and Applied Materials, Inc.